Improving Meals as Sources of Nutrients
A. Nutritional Quality. Smaller portions of a wider variety of foods can improve the nutritional quality of meals without increasing the calories (Table VI). For example, 6 ounces of steak with a baked potato and a tomato contain fewer calories (480 kcal) than 10 ounces of steak and a tomato (655 kcal). Substituting a roll for a high-fat salad dressing transforms a 740-kcal chef’s salad to a more healthful 590-kcal meal, with room for a fruit dessert. Decreasing the intake of fatty and protein-heavy foods and increasing the proportion of starchy foods and fruit will provide more satisfying meals that offer more food, fiber, vitamins, and minerals.
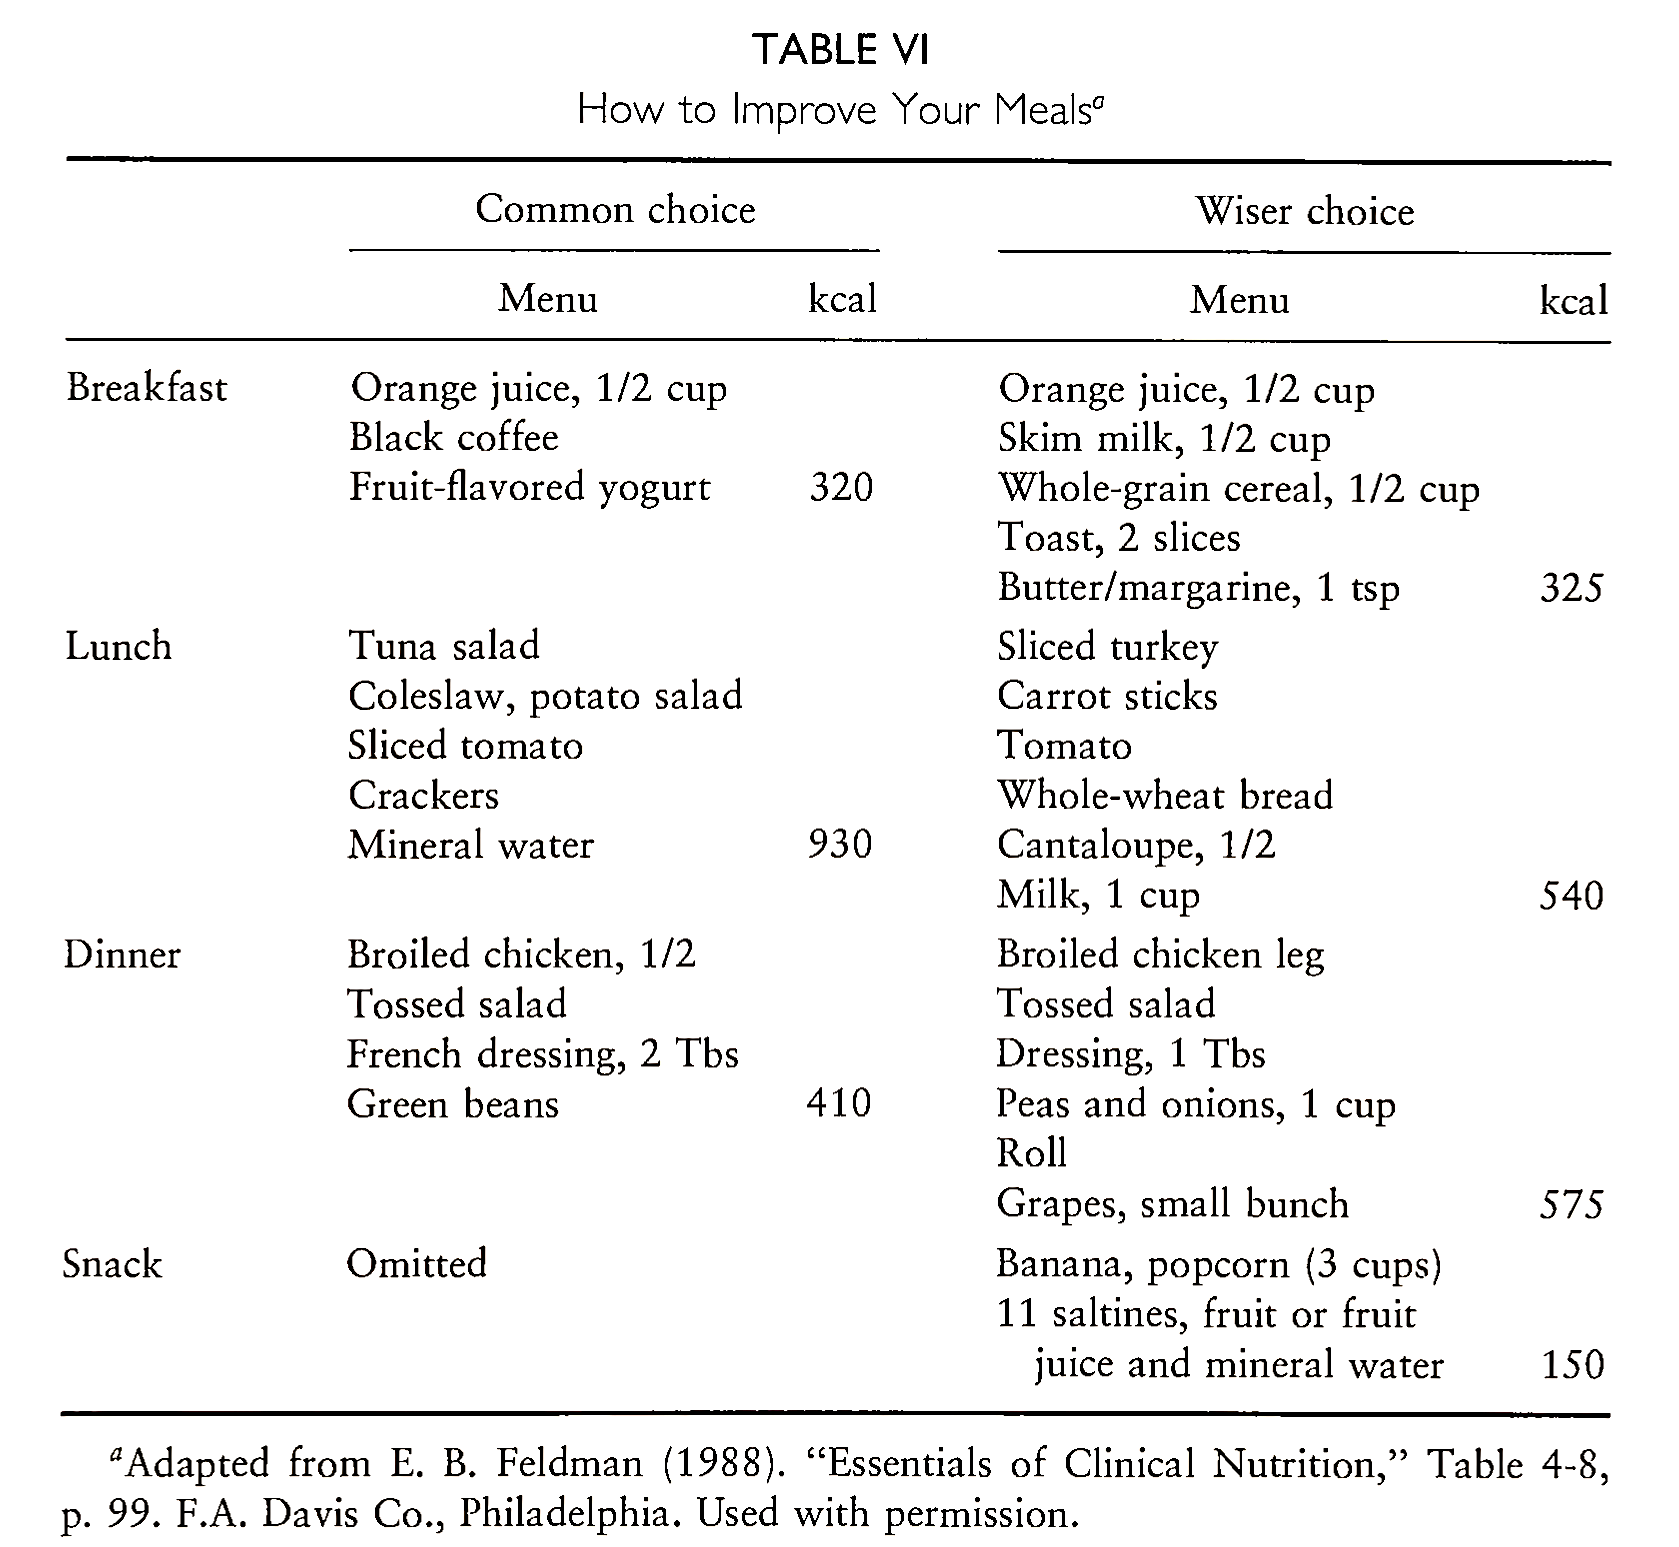
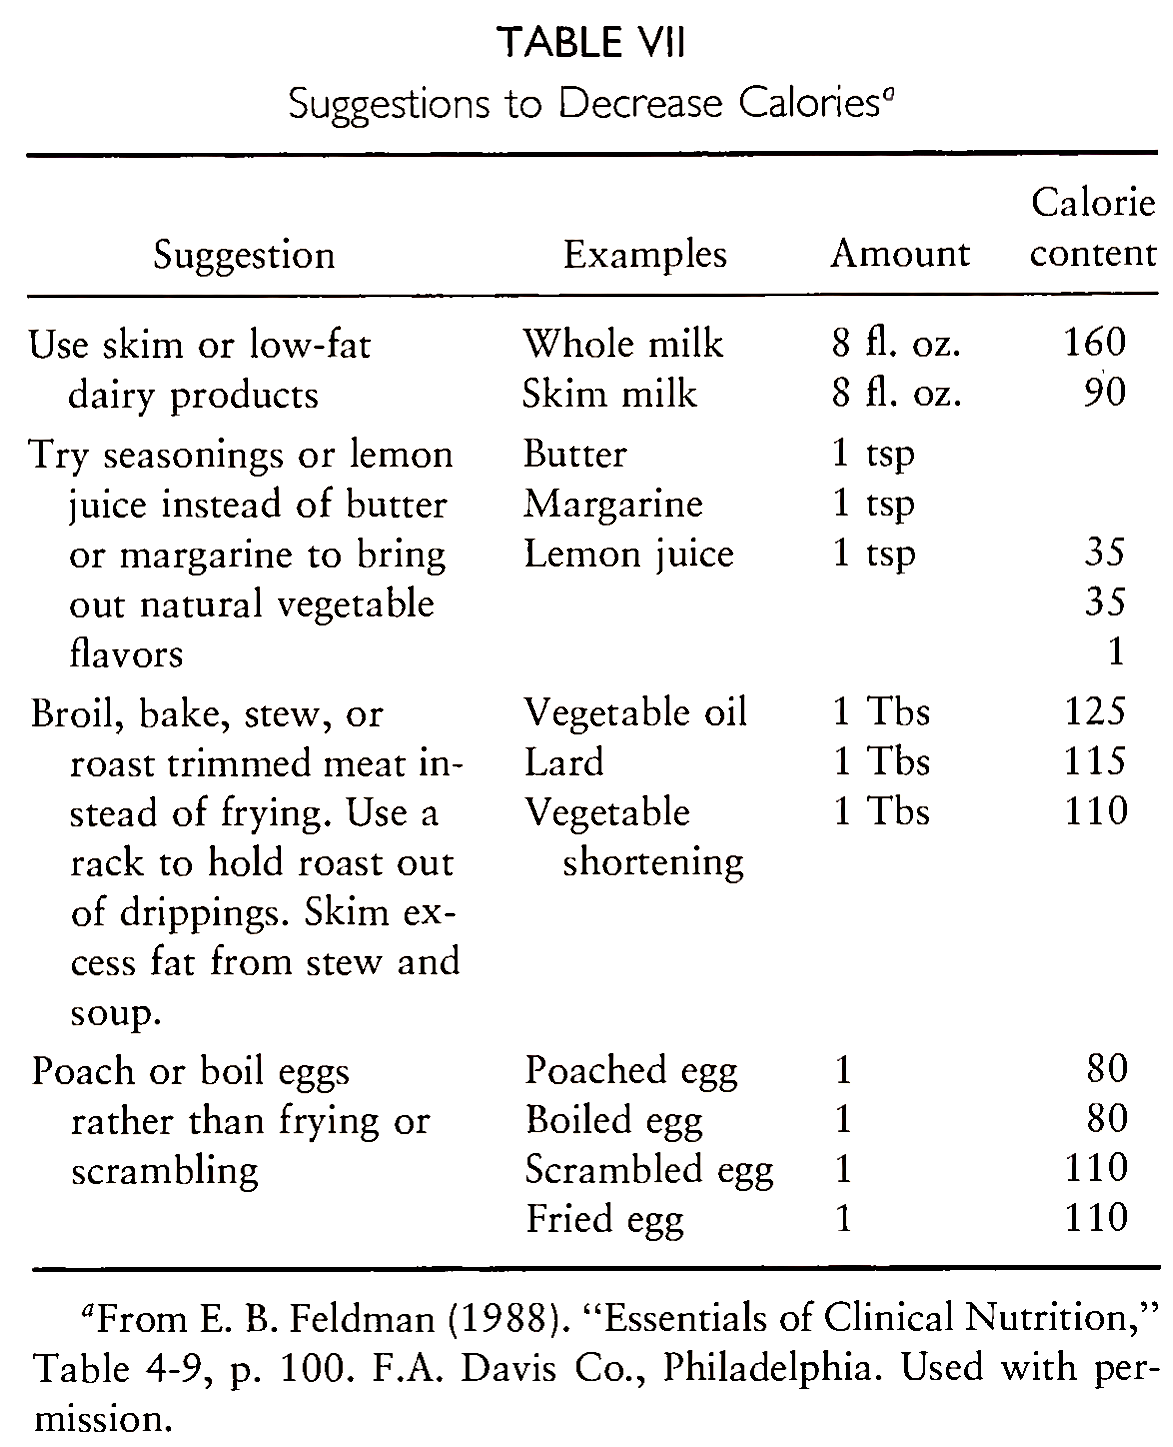
Simple changes in food preparation methods and seasoning (Table VII) lower calories without altering vitamins, minerals, or protein. More calories and nutrients can be obtained from healthful between-meal snacks such as milk shakes or peanut butter or other nut butter.
B. Determining Composition of Food. Food composition tables that provide average nutrient values based on quantitative analyses have been available for about 100 years. Most tables include data for five vitamins (vitamin A, thiamin, riboflavin, niacin, ascorbic acid), calcium, iron, energy, protein, carbohydrate, and fat. The USDA periodically publishes updated food composition tables (e.g., Handbook No. 8, “Composition of Foods”) in various sections. USDA Handbook No. 456 presents values for foods using household measures rather than the standard 100-g portions.
C. Labeling. The federal government oversees the labeling of most foods through the USDA and the Food and Drug Administration (FDA). The FDA requires listing ingredients of all foods with more than one ingredient. Ingredients are listed in descending order by weight. The Nutrition Labeling and Education Act of 1990, the first major legislation related to food labeling in over 20 years, went into effect in May 1994. The new labels, identified by the heading “Nutrition Facts,” must include serving size in standard household measure; number of servings per container; total calories; total fat and saturated fat; cholesterol; sodium; total carbohydrates, complex carbohydrates, and sugar; total protein; and dietary fiber. The information is related as percentage daily value of one serving to a normal daily diet that contains 2000 or 2500 calories, 65 or 80 g fat (30% of calories), 20-25 g saturated fat, 300 mg cholesterol, 2400 mg sodium, 300-375 g total carbohydrates, and 25-30 g of fiber.
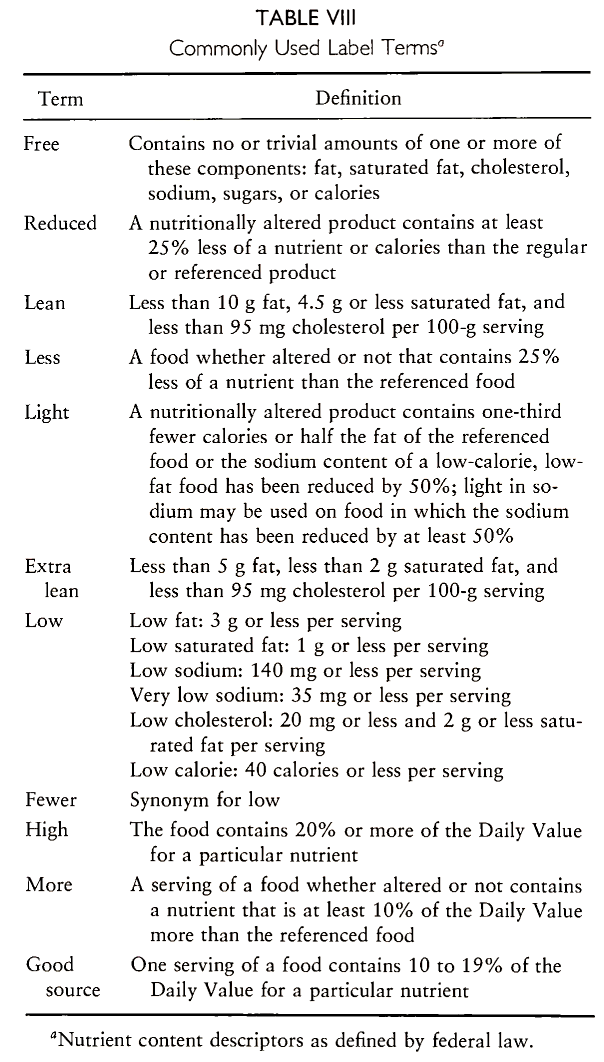
The law also gives specific definitions of descriptors used on labels (Table VIII). For the first time, specific health claims are allowed on labels that describe the link between a food or nutrient and a disease. The eight connections supported by scientific evidence include: a link between calcium and a lower risk of osteoporosis; fat and a greater risk of cancer; saturated fat and cholesterol and a reduced risk of coronary heart disease; fiber-containing grain products, fruits, and vegetables and a reduced risk of cancer; fruits, vegetables, and grain products that contain fiber and a reduced risk of coronary artery disease; sodium and a greater risk of high blood pressure;
fruits and vegetables and a reduced risk of cancer; and folic acid and a reduced risk of neural tube defects.
Date added: 2022-12-11; views: 769;