Large-Scale Gene Expression Profiling
In Figure 2 the general outline for a large-scale gene expression profiling strategy is depicted. Instead of starting with a hypothesis, this strategy raises the question which genes are regulated by the hormone. Therefore, this type of research can be described as question-driven as opposed to hypothesis-driven research, and its primary goal is to generate gene expression profiles.
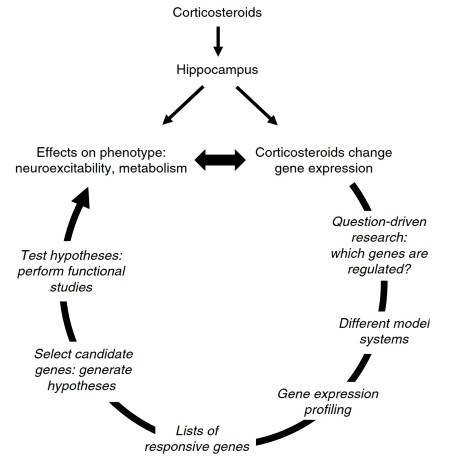
Figure 2. Outline for a large-scale gene expression profiling strategy. In order to elucidate the molecular mechanisms underlying the corticosteroid-mediated effects on the hippocampal phenotype, large-scale gene expression profiling techniques are used to assess corticosteroid-responsive genes. Candidate genes are selected and hypotheses are generated as to how these genes may play a role in the observed effects of corticosteroid on the hippocampus. These hypotheses are then tested in functional studies
When these profiles are established, candidate genes can be selected and hypotheses are generated as to how the selected candidate genes may play a role in the observed effects of corticosteroids on the hippocampal phenotype. Finally, these hypotheses are tested in functional studies using in vitro systems such as cell lines or in vivo systems such as transgenic animals.
Large-scale gene expression profiling can be performed in a number of ways. Two of the more commonly used techniques are serial analysis of gene expression (SAGE) and DNA microarrays.
In SAGE, gene expression profiles are established by sequencing and counting 10-base-pair-long SAGE tags that are derived from a defined position within the 3'-untranslated region of each transcript. By sequencing and counting sufficient transcript-specific tags, a representative expression profile is obtained of a tissue under conditions of interest, for example, after hormone treatment (Figure 3).
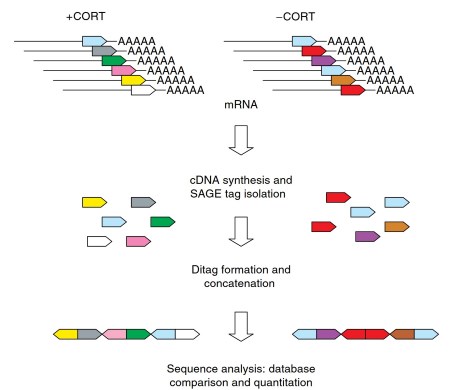
Figure 3. Serial analysis of gene expression (SAGE). In SAGE, 10-bp-long tags are generated from mRNA pools of different experimental treatment groups (for instance, corticosteroid-treated [+CORT] and control [CORT)] groups). These mRNA-specific tags are ligated to produce concatemers, which are cloned and sequenced. By counting the tag abundancies, mRNA expression levels can be estimated and compared between the different experimental groups
DNA microarrays are glass microscope slides or silica chips on which a large number of DNA sequences representing a part of each transcript are deposited at a very high density. Depending on the type of microarray, the number of represented transcripts can range from 1000 to more than 20 000. Expression levels of each transcript are measured by hybridizing labeled RNA from a tissue of interest to the microarray, thus generating a hybridization signal (mostly fluorescent) that is a measure for the expression level of the corresponding transcript.
The use of DNA microarrays has been described as following a closed expression profiling strategy, since only the expression of a predefined set of genes (i.e., the sequences that are represented on the microarray) is profiled. In contrast, by using SAGE, no selection of transcripts is made beforehand; thus, this method can be considered an open expression profiling strategy.
Date added: 2024-06-21; views: 580;