Longitudinal Methods for Calculating Active Life Expectancy
The type of cross-sectional ALE calculation that has been most often used is due to Sullivan (1971).
This calculation has great utility as a summary index of one important facet of the quality of life and human capital dynamics in a national population. It can be compared over a sequence of points in time to examine aggregate longitudinal health changes.
Such aggregate increases in health and function, however, are less useful in attempting to identify how changes in functioning occur in individuals over time or the specific factors that are associated with, and which may cause, improvements in function at late ages. Such factors, if identified, could be applied at the population level to promote continuing declines in chronic disability and disease prevalence.
This analytic effort requires considerably more longitudinal data (i.e., the tracking of individual health and disability changes), in which the measurement characteristics of the interview instrument and the survey sample design are preserved over a lengthy enough period to make meaningful estimates of ALE changes for specific elderly birth cohorts. It is also necessary that covariates that may affect the emergence of chronic disability (e.g., education, nutrition, exercise, health care, BMI) be longitudinally measured in those same surveys.
One nationally representative U.S. survey series with the appropriate longitudinal sample design and measurement characteristics to track such changes in disability and disability risk factors is the six 1982 to 2004 NLTCS. The temporal sampling and interview structure of the six surveys is briefly summarized in Figure 2.
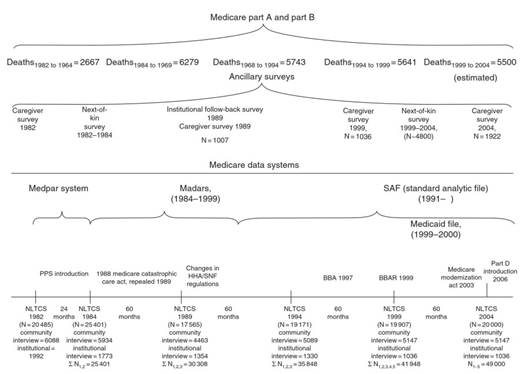
Figure 2. Observation plan, time frame, and sample sizes. World Bank Moscow Office, Economic Unit (2006), Russian Economic Report No.12, p. 20 (http://ns.worldbank.org.ru/files/rer/RER_12_eng.pdf)
In addition to the six NLTCS survey waves (1982, 1984, 1989, 1994, 1999, 2004), there is also continuous (daily) information from Medicare administrative service use and expenditure records for individuals linked to the NLTCS survey records - currently for the period 1982 to 2005.
A crucial aspect of the NLTCS for estimating longitudinal changes is that response rates were high (-95% from 1982 to 1999), so that there is relatively little chance for response bias to affect disability trend estimates. In 2004, to deal with an overall drop in the respon se rate to roughly 91%, data from longitu dinal Medicare files, availa ble for all persons in the sample, were used to adjust for health-related response bias in disability transition rate estimates (Manton et al, 2006a).
These adjustments, based on the ratio of Me dicare Part A expenditure estimates for nondisabled persons to the Medicare Part A estimates for disabled persons, were retrospectively applied to nonresponders in all NLTCS waves so that a set of longitudin al weights consistently adjuste d for nonresponse over all NLTCS 1982 to 2004 was generated (Manton et al., 2006a).
Given that one has data on changes in an individual’s functional status over time, as in the NLTCS, the question arises as to how best to estimate disa bility state transition parameters between surveys. This requires consideration of the types of disability transiti on rates one attempts to estimate and the rates of disa bility change in various age and demographic groups. There are several
possible methodo logical approac hes to estimate the necessary disa bili ty transition rates for calculating such longitudinal ALE measures.
One model that could be used is the standard dis crete time Markov model. This model is relatively crude when assessed in terms of the types of disa bility changes one can estimate and what covariates might be inc luded due to convention al sample size limitations (e.g., in the NLTCS, N ~ 20 000 persons per wave). The model also assumes that there is no higher-order time dependency - the Markov condition - and that disa bility is a homogeneous and dis crete measure.
Regress ion mode ls can also be used to estimate disa bility transition rates when the sample size is insufficient to support stratification on all relevant control variables . One type of regres sion model, due to Cox, does not require esti mating the time de pendence of hazard rates, but only that , conditio nal on covariate values, the unobserved time -de pendent hazard rates are proportional over time.
This is an empirically testa ble assumption that may not hold for long periods of observation - especial ly if the force of mortality selection on the population system ati-cally varies over disa bility status. Other re gression models employ logistic functions of the probability of discrete transitions to ensure that the estimated probabilities fall within the range 0 to 1.
In these models, there can be difficulties in trying to compare population estimates over time as temporal experience is accumulated; that is, mathematically updating transition rates with incremental adjustments for new experience collected over different periods of time can be difficult due to certain inconvenient parametric properties of logistic distributions. In all of these models, the dependent variable is a discrete change in functional status and not a continuous disability score.
An alternate approach is to use a large number of measures of functional impairment to calculate, in a multivariate procedure, convex (bounded to the range 0 to 1) continuous scores for multiple dimensions of disability. In using a principal component or factor analytic type of measurement model to calculate such disability scores, one is restricted by the assumption that the scores have a multivariate normal distribution; that is, information on moments higher than order two is lost.
An alternate method of calculating chronic disability indices involves using grade of membership (GoM) procedures (e.g., see Manton et al, 1991, 1992, 1993, 1994) in which cases are assigned by using scores to ‘fuzzy’ sets, that is, persons are generally not in one homogeneous category but share properties of two, or more, fuzzy states.
The model does not require the assumption of multivariate normality (i.e., they deal with more general distributions with informative moments of order three or higher). Furthermore, in GoM procedures, the K scores are estimated so that they sum to 1 for each person and are non-negative. This is equivalent to assuming disability changes occur in a convexly constrained multidimensional space and that the health trait scores for an individual vary between 0 and 1 for each of the K health and functional status dimensions.
In engineering studies, in which fuzzy set methods and computer algorithms are routinely used to study the dynamic control of complex nonlinear stochastic processes, such a measurement modeling step might be referred to as ‘state fuzzification,’ with the dynamics of the process studied in the more parsimonious, lower- dimension, less noisy fuzzy-state variable space. Importantly, after the fuzzy disabilities, state space process (with diffusion) is modeled, the new (forecast) distribution ofthe original disability measures can be extracted by reversing the measurement process to ‘de-fuzzify’ the distribution to get the new updated disability measure distribution.
Use of fuzzy set process models to model disabling processes has two other advantages. First, because the parameters of a continuous state stochastic process are being modeled, it is possible to calculate optimal solutions under certain marginal resource, or control variable, constraints. Second, because an individual’s state is described as a continuous mixture of K health and functional dimensions, the measure precisely quantifies the health-determined functional capacity of the population under study.
Computing multivariate convex scores (i.e., bounded by 0 to 1) in GoM is an important modeling difference, compared to the calculations of DALYs and QALYs (disability-adjusted and quality-adjusted life years, respectively) and their application to planning for maximizing health and functioning in a population under resource constraints. In the latter two procedures, health status is also scaled over a 0 to 1 range on a single dimension; for example, death has a quality-of-life value of 0 and perfect health of 1. This is done to force decisions under a Game Theoretic model with a fixed payoff; that is, a zero sum game with finite, fixed resources.
In reality, the operation of the health-care process may serve, over time, to increase economic resources to further improve future health; that is, a positive feed forward mechanism. In GoM, persons are evaluated on multiple dimensions so that there is not a fixed unidimensional choice of an optimal state; that is, exchanges might be made between different types and levels of impairment. For example, if one dimension reflects primarily physical dysfunction, and another cognitive dysfunction, there might be very different payoffs for optimizing on one dimension versus another. It is also possible that synergistic (health-enhancing), as well as antagonistic, interactions may emerge in the stochastic nonlinear process. Also, it is possible that the timing and sequencing of specific interventions may be crucial to the disabling dynamics.
Stated differently, using the GoM-characterized multidimensional state of active life expectancy, the primary optimization criteria (e.g., using the scores in a quadratic optimization problem) could be an objectively identified set of health states where the status on different health dimensions for specific persons can be improved.
This arises because this model views increased investment in health expenditures as a way to increase human capital productivity as a strategy for stimulating economic growth. It is arguable that this occurred during techno- physiological evolution as discussed by Fogel and Costa; that is, the work capacity and productivity of each person might increase over time as nutrition improved and body size and work capacity grew. Arguments by Flynn and others suggest such enhancements may have also occurred in cognitive skills (i.e., I.Q. increased) - again, possibly due to improved nutrition, better education and health, and smaller family size.
Under these conditions, it would be erroneous to assess health on one dimension with a maximum value of one. This is made clear in evaluations of human capital, in which skill level, training, and socioeconomic factors have to be considered in adding quality dimensions to human capital calculations.
Date added: 2024-02-03; views: 712;