Active Life Expectancy: Definition and Operationalization
To quantify the popu lation health consequence s of improved su rvival, Sullivan (1971) argued that survival curves estimated from U.S. vita l statistics dat a could be paired with age-specific disability or disease prevalence data provided by national health surveys to calcula te the average amount of time that one could expect to live in a healthy state in a national population; i.e., active life expect ancy, or ALE. This quantity could be compared to total life expectancy, with changes in the rati o of those two quantities be ing a sensitive measure of population health dynamics and the rate of creation of human cap ital at later ages.
The calculation of ALE over time on a crosssectional basis (the Sullivan methodology) is illustrated in Figure 1, where we present total age-specific survival and survival without disability observed for 1935, 1999, and projected to 2080 (Manton et al., 2006b). In all of our ALE computations, U.S. longitudinal data will be used.
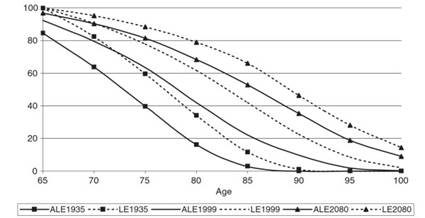
Figure 1. Survival curves for 1935,1999, and 2080. Source: United Nations (2007), World population prospects: The 2006 Revision
The survival curves in Figure 1 are based upon longitudinal data from the 1982 to 1999 NLTCS that were used to make survival and age-specific chronic disability prevalence estimates (Manton and Gu, 2001) from historical data on the Civil War veterans analyzed by Fogel and Costa, and from official U.S. life tables. Future projections of ALE were made from these curves using an assumption of a 1.7% per annum decline in the prevalence of chronic disability (Singer and Manton, 1998; Manton etal, 2006b). In Figure 1, the dotted lines are survival curves. The solid lines are age-specific disability prevalence rates among survivors to each age.
Figure 1 suggests that there is a considerable increase in ALE over time, both absolutely and proportionally (morbidity compression), above age 65. The increases in ALE above age 85 are, interestingly, relatively even greater than those found at age 65.
In Manton et al. (2006b), the relatively faster rate of ALE increase, especially at age 85+ when long-term care (LTC) use is most prevalent, suggested that the projected rapid growth of both Medicare and Medicaid expenditures to 2080 (i.e., to reach 24% of total GDP) might be significantly dampened if the observed trend (1982 to 2004; Manton et al., 2006a) toward the reduction of chronic disability prevalence were to continue at the rate of roughly 1.5% per annum (Singer and Manton, 1998). This would have to occur even with the projected large increases in survival at advanced ages; e.g., almost 15% of persons alive at age 65 are expected to survive to age 100 in 2080.
These ALE calculations (Sullivan, 1971), based on the sequential comparison over time of national life tables and disease and disability age-specific prevalence rate crosssections, are also important because they help illustrate (1) potential changes in human capital in the U.S. aging population due to the effects of compression of morbidity and (2) how recent public health, education, and clinical innovations and the future benefits of current investments in biomedical research may help drive future changes in ALE and human capital at later ages.
The latter point is crucial to the debate about the rate of growth of U.S. health expenditures and the future size, relative to GDP, of the Medicare and Medicaid programs. Specifically, if appropriately targeted acute and post-acute care medical expenditures operate to increase the proportion of life after age 65 that can be expected to be lived in potentially socially or economically productive states, then increases in Medicare expenditures may be beneficial to human capital creation and maintenance, and thereby further stimulate economic growth and increase GDP.
If GDP can be significantly increased due to such targeted investments in health care, then the proportion of GDP spent on expenditures on health care in the future may grow relatively less rapidly than in current Medicare Trust Fund and Medicaid projections.
One issue for continuing debate is the sources of the declines in disability at later ages. Cutler and colleagues, analyzing the 1982 to 1999 NLTCS, suggest that a large proportion of recently observed declines in chronic disability at later ages may be due to improved medical management of circulatory diseases (see ‘Further Reading’).
The importance of medical innovations in reducing chronic disability also has been suggested by a number of other economists. Behavioral changes such as reductions in male smoking rates and increased educational attainment at later ages have undoubtedly contributed to the observed declines in chronic disability - as have changes in Medicare reimbursement policy (e.g., the Balanced Budget Act of 1997), which mandated the use of prospective payment for skilled nursing facilities.
One of the crucial issues in the construction and interpretation of ALE estimates is how disability is to be measured. For example, one approach is to assess whether a person has difficulty performing activities of daily living (ADLs) (Katz etal., 1963) or instrumental activities of daily living (IADLs). It is generally agreed that the disability measured should be chronic in nature (expected to last 90+ days) and involve physical, sensory, and cognitive components.
Other analysts have used panels of experts to subjectively weight the functional impact of specific impairments. Some suggest that objective physical performance tests should be employed, such as the Nagi items. Others would like to include clinical measures, although practical concerns may apply when attempting to do so in in-person home visits in a large nationally representative survey.
In general, the wide range of possible disability measures available suggests the need for objective multivariate statistical procedures to identify the smaller number of core disability dimensions represented by the measures - each of which may be relatively crude and subject to error.
Although individual measures of ADLs and IADLs may be crude, their ability - taken as a group - to predict both service use (e.g., Medicare expenditures) and mortality is quite high, so ADLs are frequently used in policy studies, legislation, and in service use eligibility criteria (e.g., by HIPPA based on the Health Insurance Portability and Accountability Act (HIPAA) in setting LTC standards; for example, impairment in two or three ADLs requiring personal assistance as a trigger to receive LTC insurance benefits).
The fact that disability is multidimensional and dynamic suggests that a single ALE index (e.g., defined as the threshold of the sum of ADLs), although conceptually useful, is probably too crude for effective economic and actuarial Medicare and Medicaid policy studies. For realistic use in economic and health policy analysis, the disabled portion of total life expectancy should be broken down into several subtypes, or be continuously graded on several qualitatively distinct dimensions, using disability scores rigorously constructed in a multivariate procedure.
For example, in an economy dominated by information technology, physical impairments may be less important than cognitive impairment for many socially and economically important activities. This is in part due to the ability to at least partially compensate for physical impairments by the appropriate construction of physical space (i.e., office buildings and private residences), the creation of physical aides, and, in the future, even re-engineering of various body parts (e.g., currently, the intraocular lens replacement for cataracts, knee and hip replacements).
In addition, Fogel and other economists have recently argued that, in a modern industrial economy, the relative rate of short-term expenditures on health care perhaps should increase as a proportion of total GDP as expenditures made on, say, electronics and other consumer goods become saturated and as disposable income increases.
Fogel suggests that if the short-term elasticity of healthcare expenditures is 1.6%, then the relative share of GDP spent on health care could increase to roughly 20% without adverse national economic consequences; that is, we will make relatively more expenditures on preserving human health as our ability to saturate consumer demands (e.g., for televisions) and to manufacture highly durable electronics and robust machinery (e.g., automobiles with smart chips to monitor their internal state for efficient, prophylactic maintenance) increases. Other economists have projected that in the United States up to 30% of GDP could be spent on health care by 2050.
Thus, as durable goods have increased in longevity and durability, it is reasonable to argue that equivalent or greater expenditures need to be made on maintaining and improving human capital by increasing human longevity and durability (health and functioning). An analogue of this capital maintenance process in humans is to improve early diagnosis of disease and to monitor and improve individual health states (e.g., use of indwelling insulin reservoirs to better maintain blood glucose homeostasis as evaluated in real time by a microchip blood glucose sensor; indwelling cardiac defibrillators; and, recently, use of left ventricular cardiac assist devices).
Date added: 2024-02-03; views: 827;