Senescence. Some Demographic Considerations
We consider the issue of senescence in the life cycle context for a couple of reasons. First, while zygote-to-zygote cycles continue indefinitely, senescence and death are an inevitable end stage in the life cycle for the individual. Or are they? That in part philosophical question is the second reason for our attention: Is it possible that microorganisms as opposed to macroorganisms escape senescence? Is any organism that grows as a clone ‘immortal’ or ‘potentially immortal’ as is routinely claimed and does this descriptor even have any useful biological meaning? Why has senescence evolved?
At the level of the individual, senescence is generally defined as a decline in physiological function with age manifested by an increasing probability of death and declining fecundity (Finch 1990; Rose 1991; Ricklefs 2008). It has been argued persuasively that both attributes need to be considered (though commonly they are not) because they are interdependent and selection acts on the product of survival and fecundity (Partridge and Barton 1996; Pedersen 1999).
What is termed senescence of individuals in botany is often called aging in medicine and zoology, although usage varies and some authors (e.g., Stearns 1992; Baudisch 2008, 2011) do not use the terms synonymously. Clearly, the many physiological changes that accompany increasing age span the gamut from being innocuous correlates (such as changes in color and density of body hair in humans); to changes rendering the individual increasingly vulnerable to extrinsic sources of mortality (e.g., decrease in auditory or visual acuity, reaction time, flexion, endurance, and bone strength); and ultimately to those that are pathophysiological and potentially lethal in themselves (e.g., cancer) (Fig. 6.5 and Williams 1999). Although senescence is popularly assumed to depict the senility and frailty accompanying old age, in an evolutionary context it is classically taken to begin much earlier, at about the time of sexual maturity in humans and some animals. Of course, in actuarial terms, increasing death rates may not become striking until later in life. The reasons for this are discussed later when we take up the evolutionary aspects of senescence.
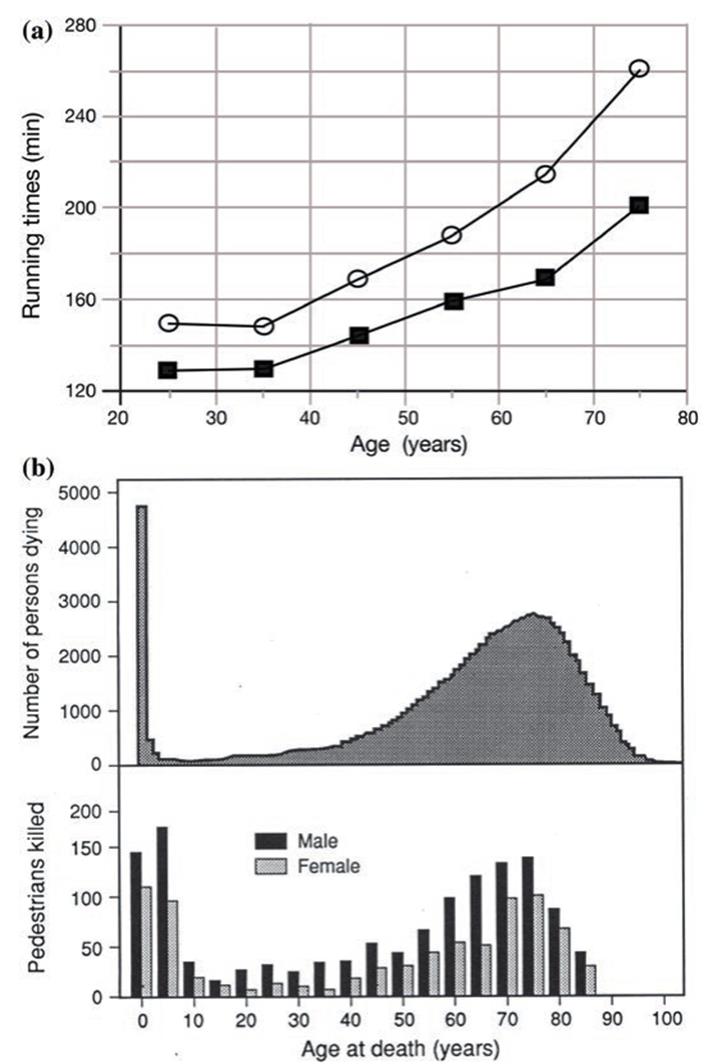
Fig. 6.5. Manifestations of senescence: a Declining functional capacity with age: the mean running times of the top 10 male (blackboxes') and female (open circles') athletes in 65 marathons. From Leyk et al. (2007). Reproduced from International Journal of Sports Medicine by permission of Thieme Publishers (www.thieme. com) ©2007. The distinguished evolutionary biologist G.C. Williams presented similar data (1999) for a single individual, presumably himself, from age 52 to 63, as his capability declined. b Distribution of deaths from all causes (top) is similar to pedestrian deaths in road accidents (bottom), showing a peak at the outset of life and increasing with advanced age. Redrawn from Comfort (1979) based on data of DeSilva (1938) and Lauer (1952). Reprinted from The Biology of Senescence, 3rd Ed. by A. Comfort. Reproduced by permission of Elsevier Science Publishing Co, Inc. ©1979
Some Demographic Considerations. Senescence.At the population level, senescence is quantifiable within a cohort as an increasing mortality (decreasing survivorship) rate with age as physiological decline takes its toll. The factors responsible have been categorized broadly as inherent (intrinsic), i.e., attributable to disability and disease (e.g., cancer, stroke, cardiovascular malfunction), or as increased vulnerability to mortality from extrinsic sources (e.g., accidents; extreme weather events). The resulting hypothetical plots (Figs. 6.6 and 6.7) with more-or-less extreme variation, are descriptive of the process in perhaps most multicellular animals (indeed of unitary organisms generally) and, importantly, are the form on which the classic theories of senescence are based.
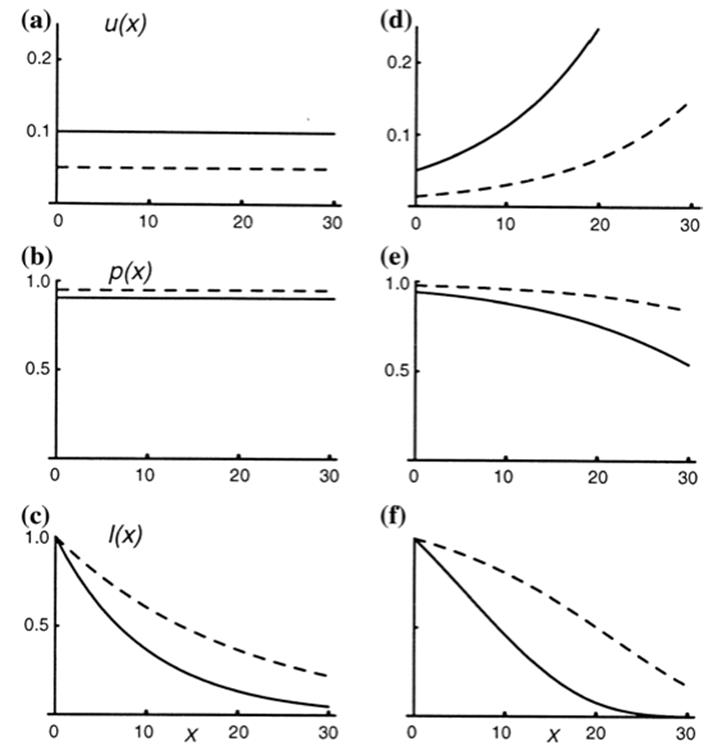
Fig. 6.6. Models contrasting two cases either without (column a–c) or with (column d–f) senescence over time characterized by three attributes: (i) mortality rate (row a, d); (ii) age-specific survival probability (i.e., probability at a given time of surviving to the next increment in time; (row b, e); and (iii) cumulative probability of surviving from birth to age x (row c, f). Two life histories are shown in each case represented by two different but constant mortality rates in the non-senescent example: 0.05 per unit time (dashed line); 0.1 per unit time (solid line). Note from the survival probabilities (c, f) that either life history can result in long-lived individuals, i.e., life span cannot be used to infer presence or absence of senescence. Compare with non-senescence in . Fig. 6.10. From Pedersen (1999). Reproduced from Life History Evolution in Plants, T.O. Vuorisalo and P.K. Mutikainen (Eds.). ©Kluwer (1999), reproduced by permission of Springer ©2001
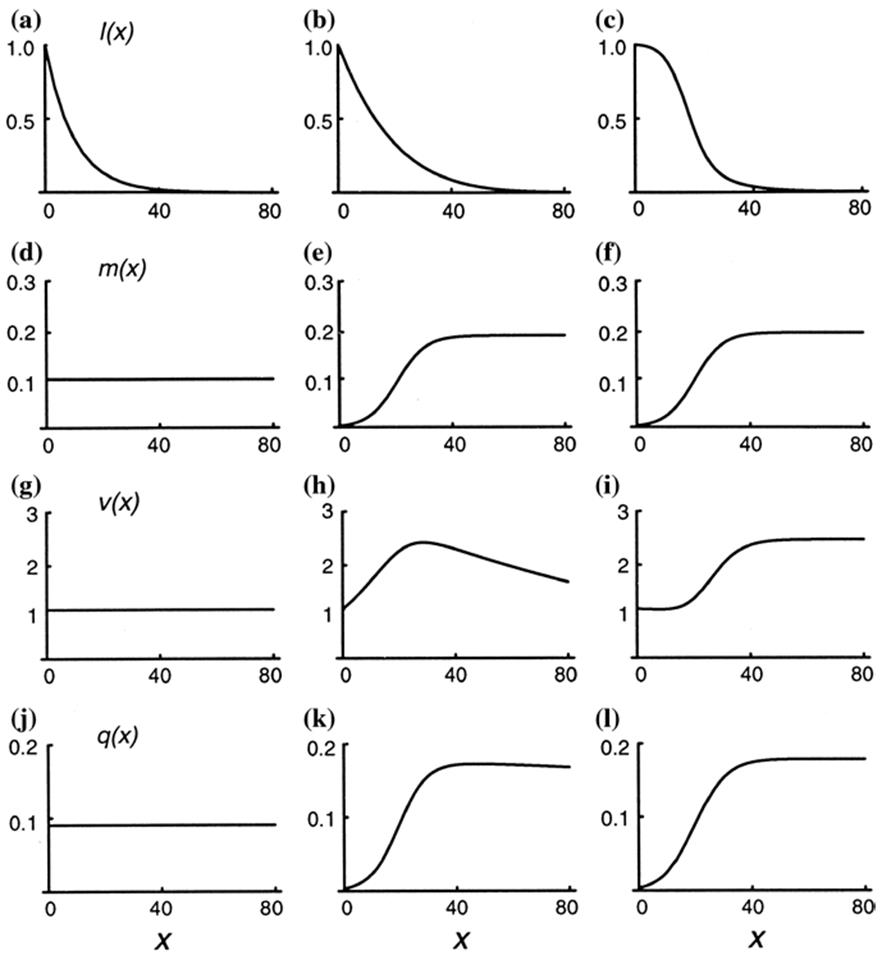
Fig. 6.7. Models illustrating demographic aspects of senescence as a function of time with respect to four attributes: (i) probability of survival from birth to age x (top row of figs. a-c); (ii) fecundity at age x (second row, d-f) ; (iii) reproductive value (third row, g-i); and (iv) the product of age-specific survival probability and fecundity (figures j-l). Three life histories are shown: the first column (figures a, d, g, j) depicts constant death and fecundity; the second column (b, e, h, k) shows increasing mortality according to the Gompertz model (see text); the third column (c, f, i, l) shows the case of constant mortality at advanced age. Note that if senescence is defined based on reproductive value, only the second life history depicted in b, e, h, k shows senescence. From Pedersen (1999). Reproduced from Life History Evolution in Plants, T.O. Vuorisalo and P.K. Mutikainen (Eds.). ©Kluwer (1999), reproduced by permission of Springer ©2001
Non-senescence If the mortality rate is constant with age, however, as noted in one case in both Figs. 6.6 and 6.7, the number of survivors declines exponentially with time. Obviously this may occur rapidly or very slowly depending on the coefficient of the exponent. The demise of glass tumblers in a cafeteria (Brown and Flood 1947) or Medawar’s famous test tube analogy, described later, follows an approximate non-senescent decline as do some organisms in nature. Such plots have given rise to the ambiguous adjective ‘potentially immortal’, also discussed later.) In other semantics, Baudisch and colleagues (e.g., Baudisch 2008; Vaupel et al. 2004; Baudisch et al. 2013) refer to organisms like Hydra as having ‘negligible senescence’ (cf. ‘negative senescence’, below and G. Bell 1984; Chap. 4 in Finch 1990; Pedersen 1999; Finch 2009; Munne-Bosch 2015).
Non-senescent curves also could, in principle, imply simply that populations in the wild are pruned by high mortality early in life before senescent decline can appear significantly in actuarial terms. Therefore, such plots may not necessarily be evidence against intrinsic senescence of the individual, simply that non-senescence cannot necessarily be inferred from the demographic data. However, the notion that wild animals do not survive long enough to show senescence, once dogma, appears to be largely discounted at least probably for most animals by relatively recent research (Gaillard et al. 1994; Nussey et al. 2013; plants do survive long enough for senescence to appear in at least some species, discussed later; see Roach 1993; Munne-Bosch 2015).
It is noteworthy and counterintuitive that short-lived organisms (by our standards as humans), such as many small birds, may still experience senescence and, conversely, that a constant rate of mortality (if low enough) can still result in very old members of a cohort. Thus, non-senescence does not imply longevity and the occurrence of very long-lived exemplars of various taxa (Chap. 5 and this section) is not, of itself, evidence for absence of senescence (Fig. 6.6 and Pedersen 1999). As Caswell (1985) noted, the alternative to senescence is not immortality but a mortality rate that does not increase with time. Indeed there is considerable confusion in the literature between longevity and senescence. The ramifications are discussed later when we take up the evolutionary theories of senescence.
Negative senescence Finally, for many organisms there may be a generally increasing expectation of life over time (Pearl 1940; Haldane 1953; Chap. 1 in Comfort 1979; Jones et al. 2014) evidenced by declining mortality rates and increasing reproductive output with age. This pattern is now popularly referred to as ‘negative senescence’ (Munne-Bosch 2015). Apparently this is the case for many plants and possibly certain animals (among unitary organisms this may possibly include some reptiles, fish, and amphibians; however, see Warner et al. 2016 on turtles). Herbaceous perennials and many shrubs and trees appear to belong to this group or the ‘negligible senescence’ category above (Harper 1977; Watkinson and White 1985; Petit and Hampe 2006; Baudisch et al. 2013; Munne-Bosch 2015). Indeed, this pattern appears to typify many modular organisms (Chap. 5), in particular those that are clonal. The demographic theory for plants is more complex and unlike that for unitary animals primarily because of differences in their structure, developmental biology, reproduction, and environmental relationships (see section below on macroorganisms and Harper 1977; Caswell 1985; Roach 1993; Roach and Carey 2014). Their life events are frequently more size- and stage-dependent rather than age-dependent. A constant or declining mortality rate would be anticipated in general for modular clonal organisms at the level of the genet whether animal, plant, or microbe. These points and the evidence are examined in the following sections.
Date added: 2025-06-15; views: 328;