Measurement of Influences within Acceptance Behavior
I. Disconfounding of Influences. To begin to understand the bases of food acceptance, the classes of influence on it must be distinguished and varied independently of each other. Acceptances can be categorized according to the influence(s) on them, as follows.
a. Palatability and Satiety. The palatability of a food can be assessed only by the difference that the purely sensory factors make to intake, or to some other measure of acceptance. The immediate sensory influences must not be confounded by other influences (e.g., secondary cognitive or physiological effects of palatibility or the effects of the swallowed food).
Conversely, meal size cannot be a valid measure of postingestional effects unless both sensory effects and changes in reactions to sensory factors induced by the stimulation from them (e.g., “sensory satiety”) have been excluded.
Even the fine details of the temporal pattern of eating movements or food intake are insufficient to diagnose influences within acceptance behavior. Dissociations (i.e., zero correlations) between parameters of the micropattern over different meals (or different eaters) would be evidence that there are distinct influences. What these influences are, though, can only be determined by varying putative causes and getting a closely related variation specifically in one of the dissociated parameters. To have valid measures, we must show how the ingestive movements in response to a pang do differ qualitatively from those in response to a craving.
b. Nutrient-Specific Effects. Similarly, the choice of one nutrient preparation over another is not necessarily controlled by nutritional physiology. If the foods differing in nutrient composition also differ in sensory characteristics, with or without palatability differences, the relative acceptances of these foods might have nothing to do with nutrition.
For example, a wish to eat conventional snack foods, which are rich in carbohydrate and fat content and relatively low in protein content, should not be interpreted as a carbohydrate craving, or as being mediated by effects of low protein content on the brain, until an explanation in terms of a habit of eating this range of food types for their sensory characteristics has been excluded.
By the same criterion, differences in food acceptance (whether as actual intakes or in appetite ratings), induced by foods that obviously differ in character as well as in nutrient composition, are not evidence for differences in the satiating or appetizing power of these nutrients, or indeed of the sensory differences (e.g., sweetness). People acquire strong expectations from experiences of recognizable foods. These learned responses can be sufficient to affect appetite hours after eating a particular type of menu. The acceptance data need not reflect any physiological action of the food.
2. Ascribed Differences versus Observed Differences. People can ascribe different strengths to influences on their food acceptance (e.g., “Taste is more important to me than texture,” “I never get hunger pangs,” or “I rate healthiness higher than palatability”). This sort of data has often been used to assess the relative importance of categories of influence. However, what people are aware of, especially in retrospect, may have little to do with what is actually influencing them. It might reflect no more than their own positions on conventional theories and current topics of discussion.
That is to say, the wording of a rating cannot in itself make it a measure of what those words refer to, be it a subjective experience or an objective aspect of food composition, bodily state, or the context of the eating or purchasing occasion. So-called “direct” scaling is an illusion. Whether the rating uses a magnitude estimation procedure, visual analogs, or multiple categories, what the scores actually measure depends entirely on the precision of their relationship to an observed factor in the food, the body, or the context, or, indeed, to acceptance responses.
Furthermore, for a verbal test to identify influences on acceptance, its results would have to measure the relationship of differences in acceptance to differences in the putative influences, whether they be in the food’s sensed characteristics, the physiological state affected, or the cultural role of the food.
3. Is Preference a Dimension? This also means that it is not coherent to treat acceptance data (or preferences and likings) as quantitative values on a scale or dimension, as they are commonly treated in consumer behavior and economics. The real phenomenon, the causal process, or the theoretical entity is acceptance from within a perceived situation.
There is a psychological scale in preferences, but it is the relationship between the multidimensional combination of the influences operative in a person and the acceptance, or hedonic response. This relationship is latent in these data by themselves, hidden behind or underneath the observations. It is not recoverable from the preference data alone unless the latent structure is simple enough to be guessed and we have enough data to discriminate this causal model from other models.
There are several psychological reasons why the structure of influences on the acceptance of food is usually much more complicated than allowed by the assumption of a preference dimension. Some consumers might put the influences together in ways qualitatively different from others’ preference structures. Also, what influences the acceptance of a food might vary with the situation (e.g., whether other foods are present, expected, or recently experienced, or what the somatic or social context is).
Moreover, the preferred value of an influence sometimes is at an intermediate level. This is certainly the case for most of the salient sensory influences on acceptance. This creates a preference peak instead of the monotonic relationship between an influence and acceptance that standard modeling techniques assume. Different consumers have different peak values or ideal points for each influence. Most devastating of all to the grouped analysis of preference structures, people put together influences in idiosyncratic ways to generate overall acceptance, preference, and choice.
Therefore, we have only one general approach to the understanding and measurement of food acceptance behavior. This is to collect the individual’s acceptance data together with data on the major influences relevant to the objectives of the investigation and to complete an analysis of each person’s preference structure before attempting to generalize or aggregate.
4. Individual Measurement of Acceptance Structure. Each discrete influence on a person’s food acceptance forms a subscale or psychophysical function on the acceptance responses. Even if this causal relationship is peaked, this peak is symmetrically linear whenever the consumer is allowed to express unbiased personal preference in a sufficiently familiar situation (Fig. 2). The basis of this theory is that people decide what they want on the basis of the differences of the alternatives available from the most preferred levels of the operative influences, measured in units of equal discriminability.
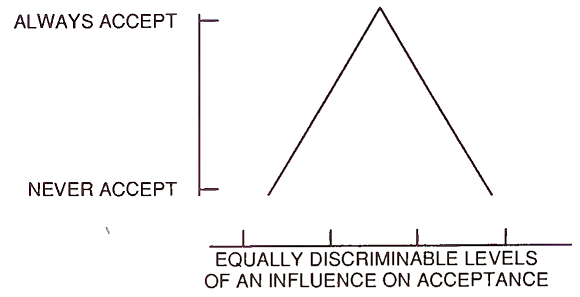
FIGURE 2. The acceptance triangle (also called the appetite triangle, the isosceles tolerance triangle, and the hedonic inverted V) represents the cognitive mechanism by which the excitation of an individual consumer’s disposition to accept food declines proportionally to the discriminable distance of the presented level of a discrete or integrated influence on acceptance from the personally acquired most facilitatory level of that influence
Then, in the probably not uncommon case of a food acceptance behavior that is explicable by a single integration point (Fig. 3), acceptance has a “cognitive algebra” of Pythagorean combinations.
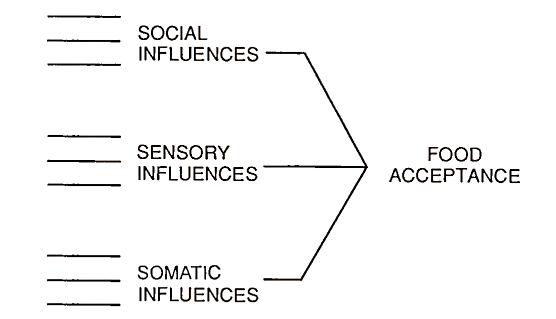
FIGURE 3. Different categories of immediate influence on an individual purchaser’s or eater’s acceptance of a food item, integrated through a single personal equation established by effects of past experience on inherited potentialities. This is the simplest type of causal model and such a multidimensional discrimination hierarchy should be refuted before multinodal attitudinal networks (such as in Fig. 1) are used in data analysis
The personal acceptance structure can be expressed graphically as a response space. This maps the variation in acceptance by that individual against variations in all of the potential influences over their tolerated ranges. These personal response spaces can simply be summed across a representative sample of consumers, to provide highly precise, completely operational, and totally disaggregatable estimates of the response to particular propositions in any segment of the market.
Date added: 2022-12-11; views: 770;