Accessing the Data Warehouse
This section discusses how users can exploit information stored in the data warehouse for decision making. In the following subsection, after introducing the particular features of the multidimensional model, we will survey the two main approaches for analyzing information: reporting and OLAP.
The Multidimensional Model. The reasons why the multidimensional model is adopted universally as the paradigm for representing data in data warehouses are its simplicity, its suitability for business analyses, and its intuitiveness for nonskilled computer users, which are also caused by the widespread use of spreadsheets as tools for individual productivity. Unfortunately, although some attempts have been made in the literature to formalize the multidimensional model, none of them has emerged as a standard so far.
The multidimensional model originates from the observation that the decisional process is ruled by the facts of the business world, such as sales, shipments, bank transactions, and purchases. The occurrences of a fact correspond to events that occur dynamically: For example, every sale or shipment made is an event. For each fact, it is important to know the values of a set of measures that quantitatively describe the events: the revenue of a sale, the quantity shipped, the amount of a bank transaction, and the discount on a purchase.
The events that happen in the enterprise world are obviously too many to be analyzed one by one. Thus, to make them easily selectable and groupable, we imagine arranging them within an n-dimensional space whose axes, called dimensions of analysis, define different perspectives for their identification. Dimensions commonly are discrete, alphanumeric attributes that determine the minimum granularity for analyzing facts. For instance, the sales in a chain of stores can be represented within a three-dimensional space whose dimensions are the products, the stores, and the dates.
The concepts of dimension gave birth to the well-known cube metaphor for representing multidimensional data. According to this metaphor, events correspond to cells of a cube whose edges represents the dimensions of analysis. A cell of the cube is determined uniquely by assigning a value to every dimension, and it contains a value for each measure. Figure 3 shows an intuitive graphical representation of a cube centered on the sale fact.
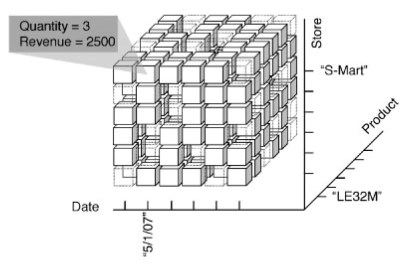
Figure 3. The three-dimensional cube that models the sales in a chain of shops. In the S-Mart store, on 5/1/2007, three LE32M TVs were sold, for a total revenue of $2500
The dimensions are product, store, and date. An event corresponds to the selling of a given product in a given store on a given day, and it is described by two measures: the quantity sold and the revenue. The figure emphasizes that the cube is sparse, i.e., that several events did not happen at all: Obviously, not all products are sold every day in every store.
Normally, each dimension is structured into a hierarchy of dimension levels (sometimes called roll-up hierarchy) that group its values in different ways. For instance, products may be grouped according to their type and their brand, and types may be grouped additionally into categories. Stores are grouped into cities, which in turn are grouped into regions and nations.
Dates are grouped into months and years. On top of each hierarchy, a final level exists that groups together all possible values of a hierarchy (all products, all stores, and all dates). Each dimension level may be described even more by one or more descriptive attributes (e.g., a product may be described by its name, its color, and its weight).
A brief mention to some alternative terminology used either in the literature or in the commercial tools is useful. Although with the term dimension we refer to the attribute that determines the minimum fact granularity, sometimes the whole hierarchies are named as dimensions. Measures are sometimes called variables, metrics, categories, properties, or indicators. Finally, dimension levels are sometimes called parameters or attributes.
We now observe that the cube cells and the data they contain, although summarizing the elemental data stored within operational sources, are still very difficult to analyze because of their huge number. Two basic techniques are used, possibly together, to reduce the quantity of data and thus obtain useful information: restriction and aggregation. For both, hierarchies play a fundamental role because they determine how events may be aggregated and selected.
Restricting data means cutting out a portion of the cube to limit the scope of analysis. The simplest form of restriction is slicing, where the cube dimensionality is reduced by focusing on one single value for one or more dimensions. For instance, as depicted in Fig. 4, by deciding that only sales of store ‘‘S-Mart’’ are of interest, the decision maker actually cuts a slice of the cube obtaining a two-dimensional subcube. Dicing is a generalization of slicing in which a subcube is determined by posing Boolean conditions on hierarchy levels. For instance, the user may be interested in sales of products of type ‘‘Hi-Fi’’ for the stores in Rome during the days of January 2007 (see Fig. 4).
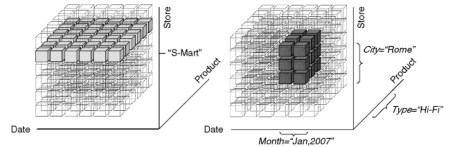
Figure 4. Slicing (left) and dicing (right) on the sales cube
Although restriction is used widely, aggregation plays the most relevant role in analyzing multidimensional data. In fact, most often users are not interested in analyzing events at the maximum level of detail. For instance, it may be interesting to analyze sale events not on a daily basis but by month. In the cube metaphor, this process means grouping, for each product and each store, all cells corresponding to the days of the same month into one macro-cell.
In the aggregated cube obtained, each macro-cell represents a synthesis of the data stored in the cells it aggregates: in our example, the total number of items sold in each month and the total monthly revenue, which are calculated by summing the values of quantity and revenue through the corresponding cells. Eventually, by aggregating along the time hierarchy, an aggregated cube is obtained in which each macro-cell represents the total sales over the whole time period for each product and store. Aggregation can also be operated along two or more hierarchies. For instance, as shown in Fig. 5, sales can be aggregated by month, product type, and city.
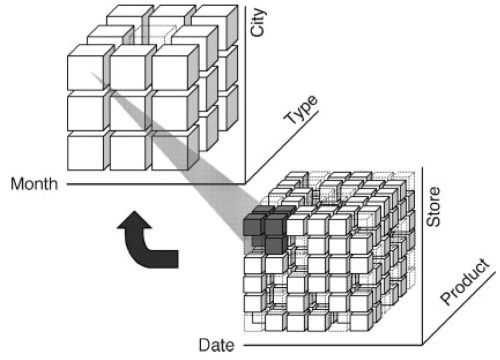
Figure 5. Aggregation on the sales cube
Noticeably, not every measure can be aggregated consistently along all dimensions using the sum operator. In some cases, other operators (such as average or minimum) can be used instead, whereas in other cases, aggregation is not possible at all. For details on the two related problems of additivity and summarizability, the reader is referred to Ref. 2.
Reporting. Reporting is oriented to users who need to access periodically information structured in a fixed way. For instance, a hospital must send monthly reports of the costs of patient stays to a regional office. These reports always have the same form, so the designer can write the query that generates the report and ‘‘freeze’’ it within an application so that it can be executed at the users’ needs.
A report is associated with a query and a presentation. The query typically entails selecting and aggregating multidimensional data stored in one or more facts. The presentation can be in tabular or graphical form (a diagram, a histogram, a cake, etc.). Most reporting tools also allow for automatically distributing periodic reports to interested users by e-mail on a subscription basis or for posting reports in the corporate intranet server for downloading.
Date added: 2024-07-23; views: 737;