Geographic Information Systems
A geographic information system (GIS) is a set of computer- based tools to collect, store, retrieve, manipulate, visualize, and analyze geo-spatial information (information identified by its location on the surface of reference, for example, the Earth).
Some definitions of GIS include institutions, people, and data, besides the computer-based tools. These definitions refer more to a total GIS implementation than to the technology. Examples of GIS definitions can be found in Maguire (1), Chrisman (2), Foote and Lynch (3) among others. Our definition is discussed next.
Computer-based tools are hardware (equipment) and software (computer programs). Geo-spatial information describes facts about the Earth’s features, for example, the location and characteristics of rivers, lakes, buildings, and roads. Collection of geo-spatial information refers to the process of gathering, in computer-compatible form, facts about features of interest. Facts usually collected are the location of features given by sets of coordinate values (such as latitude, longitude, and sometimes elevation), and attributes such as feature type (e.g., highway), name (e.g., Interstate 71), and unique characteristics (e.g., the northbound lane is closed).
Storing of geo-spatial information is the process of electronically saving the collected information in permanent computer memory (such as a computer hard disk). Information is saved in structured computer files. These files are sequences of only two characters (0 and 1) called bits, organized into bytes (8 bits) and words (16-64 bits). These bits represent information stored in the binary system. Retrieving geo-spatial information is the process of accessing the computer-compatible files, extracting sets of bits, and translating them into information we can understand (for example, information given in our national language).
Manipulation of geo-spatial data is the process of modifying, copying, or removing selected sets of information bits or complete files from computer permanent memory. Visualization of geo-spatial information is the process of generating and displaying a graphic representation of the information, complemented with text and sometimes with audio. Analysis of geo-spatial information is the process of studying, computing facts from the geospatial information, forecasting, and asking questions (and obtaining answers from the GIS) about features and their relationships. For example, what is the shortest route from my house to my place of work?
Hardware and its use. Computer hardware changes at a very fast pace most all the time. Better and better computers are available every year. This evolution impacts GIS and makes this description difficult in terms of covering what is the ‘‘state-of-art’’ in hardware. A good introduction to GIS hardware is given by UNESCO (4). Our goal here is to overview the major hardware components of GIS without trying to discuss any one in detail.
The main component is the computer (or computers) on which the GIS run. Currently, GIS systems run on desktop computers mainframes (used as a stand-alone or as part of a network), and servers connected to the Internet. In general, GIS operations require handling large amounts of information (50 megabytes or larger file sizes are not uncommon), and in many cases, GIS queries and graphic displays must be generated very quickly. Therefore, important characteristics of computers used for GIS are processing speed, quantity of random access memory (RAM), size of permanent storage devices, resolution of display devices, and speed of communication protocols.
Several peripheral hardware components may be part of the system: printers, plotters, scanners, digitizing tables, and other data collection devices. Printers and plotters are used to generate text reports and graphics (including maps). High-speed printers with graphics and color capabilities are commonplace today. The number and sophistication of the printers in a GIS organization depend on the amount of text reports and small size (typically 8.5’’ by 11’’) maps and graphics to be generated. Plotters allow the generation of oversized graphics.
The most common graphic products of a GIS system are maps. As defined by Thompson (5), ‘‘Maps are graphic representations of the physical features (natural, artificial, or both) of a part or the whole of the Earth’s surface. This representation is made by means of signs and symbols or photographic imagery, at an established scale, on a specified projection, and with the means of orientation indicated.’’ As this definition indicates, there are two different types of maps: (1) line maps, composed of lines, the type of map we are most familiar with, in paper form, for example a road map; and (2) image maps, which are similar to a photograph. A complete discussion of maps is given by Robinson et al. (6).
Plotters able to plot only line maps usually are less sophisticated (and less expensive) than those able to plot high-quality line and image maps. Plotting size and resolution are other important characteristics of plotters. With some plotters, it is possible to plot maps with a size larger than 1 m. Higher plotting resolution allows plotting a greater amount of details. Plotting resolution is very important for images. Usually, the larger the map size needed, and the higher the plotting resolution, the more expensive the plotter.
Scanners are devices that sense and decompose a hardcopy image or scene into equal-sized units called pixels and store each pixel in computer-compatible form with corresponding attributes (usually a color value per pixel). The most common use of scanning technology is in fax machines. They take a hardcopy document, sense the document, and generate a set of electric pulses. Sometimes, the fax machine stores the pulses to be transferred later; other times they are transferred right away. In the case of scanners used in GIS, these pulses are stored as bits in a computer file.
The image generated is called a raster image. A raster image is composed of pixels. Generally, pixels are square units. Pixel size (the scanner resolution) ranges from a few micrometers (for example, 5 microns) to hundreds of microns (for example, 100 microns). The smaller the pixel size, the better the quality of the scanned images, but the larger the size of the computer file, the higher the scanner cost. Scanners are used in GIS to convert hardcopy documents to computer-compatible form, especially paper maps. Wempen (7) gives a complete discussion of scanning technology.
Some GISs cannot use raster images to answer geospatial questions (queries). Those GISs that can are usually limited in the types of queries they can perform (they can perform queries about individual locations but not geographic features). The reason of this limitation is the lack of explicit information in raster images. Only the location of each pixel in a grid array and a value per pixel (such as color) are the explicit information of raster images. Explicit information is the information that can be expressed without vagueness, implication, or ambiguity, leaving no quetion as to meaning or intent. Computer programs can recognize explicit information. Raster images mainly carry tacit information.
Tacit information is information that is difficult to express, often personal or context-speciific, hard to communicate, and even harder to represent in a formal way. In general, computer programs cannot recognize tacit information. Most queries need information in vector form (that carries a lot more explicit information). Vector information represents individual geo-spatial features (or parts of features) and is an ordered list of vertex coordinates and alphanumeric and graphic attributes. Vector information is used for representation and analysis in most GIS. Figure 1 shows the differences between raster and vector.
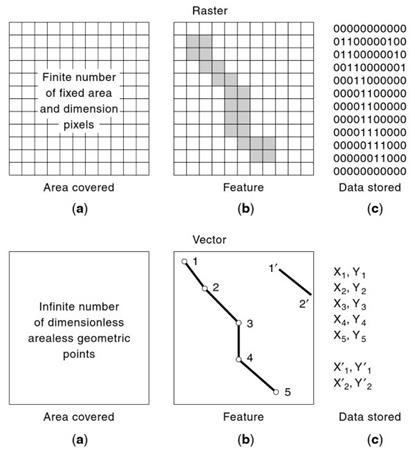
Figure 1. The different structures of raster and vector information, feature representation, and data storage
Digitizing tables are devices that collect vector information from hardcopy documents (especially maps), and they consist of a flat surface on which documents can be attached, and a cursor or puck with several buttons, used to locate and input coordinate values (and sometimes attributes) into the computer. Attributes are commonly input via keyboard. The result of digitizing is a computer file with a list of coordinate values and attributes per feature. This method of digitizing is called ‘‘heads-down digitizing.’’ Digitizing tables were the most common tools for digitizing maps, but their use has decreased in the last decade.
Currently, there is a different technique to generate vector information. This method uses a raster image as a backdrop on the computer terminal. These images are the result of scanning paper maps or derive from digital photos. Usually, the image are geo-referenced (transformed into a coordinate system related in some way to the Earth).
The raster images are displayed on the computer screen, and the operator uses the computer mouse to collect the vertices of a geo-spatial feature and to attach attributes (the keyboard or audio may be also used). As in the previous case, the output is a computer file with a list of coordinate values and attributes for each feature. This method is called ‘‘heads-up digitizing.’’ A more in-depth discussion on geospatial data acquisition in vector or raster format is given by GEOWEB (8).
Geographic Information Systems. Software
Software, as defined by the AGI dictionary (9), is the collection of computer programs, procedures, and rules for the execution of specific tasks on a computer system. A computer program is a logical set of instructions that tells a computer to perform a sequence of tasks. GIS software provides the functions to collect, store, retrieve, manipulate, query and analyze, and visualize geo-spatial information. An important component of software today is a graphical user interface (GUI).
A GUI is set of graphic tools (icons, buttons, and dialog boxes) that can be used to communicate with a computer program to input, store, retrieve, manipulate, visualize, and analyze information and generate different types of output. Pointing with a device such as a mouse to select a particular software application operates most GUI graphic tools. Voice can also be used in a GUI to communicate with a computer program. Figure 2 shows a GUI.
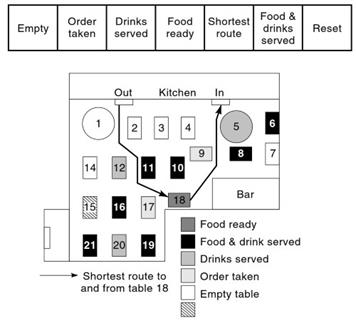
Figure 2. GUI for a GIS in a restaurant setting and the graphic answers to questions about table occupancy, service, and shortest route to Table 18
GIS software can be divided into five major components (besides the GUI): input, manipulation, database management system, query and analysis, and visualization. Input software allows the import of geo-spatial information (location and attributes) into the appropriate computer-compatible format. Three different issues need to be considered: how to transform (convert) analog (paper-based) information into digital form, how to accept digital information collected by different devices, and how to store information in the appropriate format.
Scanning, as well as heads-down and heads-up digitizing software with different levels of automation, transforms paper-based information (especially graphic) into computer-compatible form. Text information (attributes) can be imported by a combination of scanning and character recognition software, or can be imported manually using keyboards or voice recognition software. In general, each commercial GIS software package has a proprietary format used to store locations and attributes. Only information in that particular format can be used in that particular GIS.
When information is converted from paper into digital form using the tools from that GIS, the result is in the appropriate format. When information is collected using other devices, then a file format translation needs to be made. Translators are computer programs that take information stored in a given format and generate a new file (with the same or similar information) in a different format. In some cases, translation results in information loss.
Manipulation software allows changing the geo-spatial information by adding, removing, modifying, or duplicating pieces or complete sets of information. Many tools in manipulation software are similar to those in word processors, for example, create, open, and save a file; cut, copy, paste; and undo graphic and attribute information.
Many other manipulation tools allow drafting operations of the information, such as drawing parallel lines, square, rectangles, circles, and ellipses; moving graphic elements; and changing colors, line widths, and line styles.
Other tools allow the logical connection of different geo-spatial features. For example, geo-spatial features that are physically different and unconnected can be grouped as part of the same layer, level, or overlay (usually, these words have the same meaning), by which they are considered part of a common theme (for example, all rivers in a GIS can be considered part of the same layer: hydrography). Then, one can manipulate all features in this layer by a single command. For example, one could change the color of all rivers of the hydrography layer from light to dark blue by a single command.
Database management system (DBMS) is a collection of software for organizing information in a database. This software performs three fundamental operations: storage, manipulation, and retrieval of information from the database. A database is a collection of information organized according to a conceptual structure describing the characteristic of the information and the relationship among their corresponding entities (9).
In a database, usually at least two computer files or tables and a set of known relationships, which allows efficient access to specific entities, exist. Entities in this concept are geo-spatial objects (such as a road, house, and tree). Multipurpose DBMS are classified into four categories: inverted list, hierarchical, network, and relational.
Healy (10) indicates that there are two common approaches to DBMS for GIS: the hybrid and the integrated. The hybrid approach is a combination of a commercial DBMS (usually relational) and direct access operating system files. Positional information (coordinate values) is stored in direct access files and attributes in the commercial DBMS.
This approach increases access speed to positional information and takes advantage of DBMS functions, minimizing development costs. Guptill (11) indicates that, in the integrated approach, the standard query language (SQL) used to ask questions about the database is replaced by an expanded SQL with spatial operators able to handle points, lines, polygons, and even more complex structures and graphic queries. This expanded SQL sits on top of the relational database, which simplifies geo-spatial information queries.
Query and analysis software provides new explicit information about the geo-spatial environment. The distinction between query and analysis is somewhat unclear. Maguire and Dangermond (12) indicate that the difference is a matter of emphasis: ‘‘Query functions are concerned with inventory questions such as ‘Where is...?’ Analysis functions deal with questions such as ‘What if...?’.’’ In general, query and analysis use the location of geo-spatial features, distances, directions, and attributes to generate results. Two characteristic operations of query and analysis are buffering and overlay.
Buffering is the operation that finds and highlights an area of user-defined dimension (a buffer) around a geo-spatial feature (or a portion of a geo-spatial feature) and retrieves information inside the buffer or generates a new feature. Overlay is the operation that compares layers. Layers are compared two at a time by location or attributes. Query and analysis use mathematical or logical models to accomplish their objectives. Different GISs may use different mathematical or logical models and, therefore, the results of querying or analyzing the same geo-spatial data in two different GISs may be different.
Mathematical or logical models are of two kinds: (1) Embedded models and (2) external models. Embedded models are the kind of models that are used by any GIS user to perform query and analysis; they are an integral part of a GIS. For example, the models used to perform buffering and overlay are embedded models.
Embedded models in many commercial systems are similar to black boxes: You input the data and you obtain results but, in general, you do not know how these results are generated. External models are mathematical or logical models provided by the user. In some quarters, the use of external models is known as GIS modeling.
There is not a clear distinction between the discipline of scientific modeling and GIS modeling. We would hypothesize that there are two instants of modeling in GIS: (1) when the input of scientific modeling is the outcome of GIS, and GIS is the only way to produce such outcome, and the scientific model can be programmed or interfaced with GIS; (2) When the input of scientific modeling can be collected or generated by means different than GIS, but GIS may be the simple way or the most cost-efficient way to provide the input data or the software implementation of the scientific model.
In our opinion, only the first instant should be called GIS modeling. Todorov and Jeffress (13), White et al. (14), and Lauver et al. (15) present examples of GIS modeling. Wilson (16) presents an example of scientific modeling using GIS.
Query and analysis are the capabilities that differentiate GIS from other geographic data applications such as computer-aided mapping, computer-aided drafting (CAD), photogrammetry, and mobile mapping.
Visualization in this context refers to the software for visual representation of geo-spatial data and related facts, facilitating the understanding of geo-spatial phenomena, their analysis, and inter-relations. The term visualization in GIS encompasses a larger meaning. As defined by Buttenfield and Mackaness (17), ‘‘visualization is the process of representing information synoptically for the purpose of recognizing, communicating, and interpreting pattern and structure. Its domain encompasses the computational, cognitive, and mechanical aspects of generating, organizing, manipulating, and comprehending such representation.
Representation maybe rendered symbolically, graphically, or iconically and is most often differentiated from other forms of expression (textual, verbal, or formulaic) by virtue of its synoptic format and with qualities traditionally described by the term ‘Gestalt,’ ’’ and it is the confluence of computation, cognition, and graphic design.
Traditional visualization in mapping and GIS is accomplished through maps, diagrams, and perspective views. A large amount of information is abstracted into graphic symbols. These symbols are endowed with visual variables (size, value, pattern, color, orientation, and shape) that emphasize differences and similarities among those facts represented. The joint representation of the facts shows explicit and tacit information.
Explicit information can be accessed by other means such as tables and text. Tacit information requires, in some cases, performing operations with explicit information, such as computing the distance between two points on a road. In other cases, by looking at the graphic representation, we can access tacit information. For example, we can find an unexpected relationship between the relief and erosion that is not obvious from the explicit information. This example represents the power of visualization!
The most noticeable improvement in GIS recently is in visualization. Multimedia visualization that combines raster, vector, audio, panoramic views, digital video, and so on is gaining acceptance in the GIS community. Experimental systems with these capabilities are being demonstrated in university research centers and by some commercial vendors.
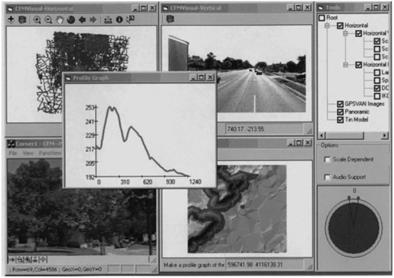
Figure 3.
Multimedia visualization systems offer the possibility of overcoming many of the problems of traditional visualizations. These systems allows dynamic, multisource, multisense, multiquality, representations of the environment instead of static, single-source, single-sense, single-quality representations. Figure 3 shows a prototype system developed by the Center for Mapping of The Ohio State University.
Date added: 2024-02-23; views: 740;