WHO Alcohol Database. Results of Data Collection
Although several attempts have been made in the past at summarizing world and regional drinking trends from a public health perspective, a key initiative from the WHO has become the most comprehensive source of data on alcohol in the world. In 1996, the WHO organized the Global Alcohol Database, bringing together the most reliable and updated information on alcohol consumption and related harm by country.
It was created by the Marin Institute for the Prevention of Alcohol and Other Drug Problems, and maintained for some time by the Swiss Institute for the Prevention of Alcohol Problems. It is currently hosted and maintained by the Centre for Addiction and Mental Health in Toronto, Canada.
Data from recorded production are included as well as data from national surveys and estimations of unrecorded consumption, health effects, national alcohol policies, and interventions. The database has information from the majority of countries in the world, although there are many gaps in the validity and reliability of the information.
In 1999 the WHO published the first Global Status Report on Alcohol, which included estimates of adult per capita consumption for most countries, relying on a combination of national and regional estimates, industry data, and data from the FAO and the UN Statistical Office (WHO, 1999). In 2001, it published the Global Status Report: Alcohol and Young People (WHO, 2001). In 2004, WHO (2004a) published the Global Status Report: Alcohol Policy and the Global Status Report on Alcohol 2004 (2004b).
The latter publication provided time-series analysis from 1961 to 2001 for all beverages, and also for beer, spirits, and wine separately, in liters of pure alcohol per adult per year in each country. Data regarding alcohol consumption from cross-border shopping, smuggling, legal or illegal home production (unless included in FAO estimates), or tourists were not included, however, estimates were given for recent years for many countries.
The adult per capita consumption estimates were based on either FAO or World Drink Trends data, except for a few countries in which data were available directly from governments. The WHO estimates of adult per capita consumption are regularly updated, in support of WHO initiatives and global burden of disease calculations.
The following section illustrates some examples of uses of the WHO database for analyzing international trends in alcohol consumption, globally and regionally. Data available up to 2003, in most cases, were used for all analysis. Even though there are methodological limitations inherent in the data, the results still provide interesting and useful information.
Results of Data Collection. Table 1 summarizes the characteristics of adult alcohol consumption in different regions of the world for the year 2002;Figure 1 represents the global trend by beverage type (beer, wine, spirits) with time-series analysis from 1961-2003.
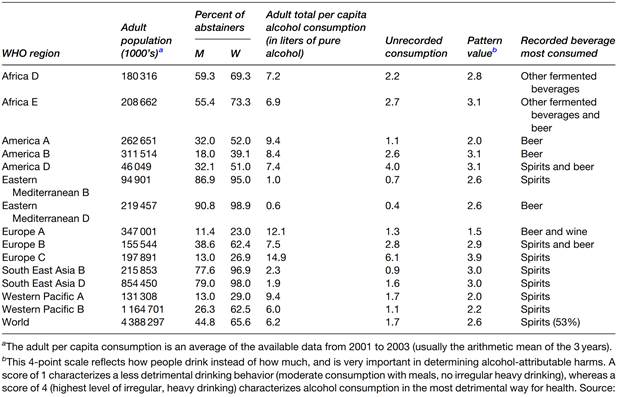
Table 1. Characteristics of alcohol consumption in the world in 2002
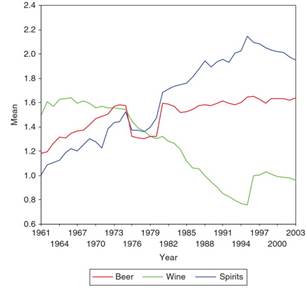
Figure 1. Beer, wine, and spirit consumption in the world, 1961–2003
In most regions, spirits represent the main source of pure alcohol in total consumption, with the most growth during the last 30 years. Beer consumption, however, is also growing. Global wine production and consumption has decreased, mainly due to decreases in consumption in Southern Europe, a leading area of production and consumption in the world (one should bear in mind that regional differences can cancel each other out therefore looking only at the data at global levels might be misleading).Figures 2, 3, and 4 are regional analyses of trends; Figure 5 shows that the two regions showing recent and continuing increases in consumption are South-East Asia and the Western Pacific.
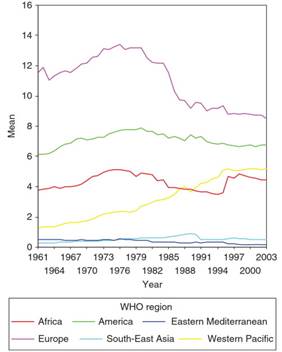
Figure 2. Adult per capita consumption in six WHO Regions: Africa, Americas, Eastern Mediterranean, Europe, South-East Asia, and Western Pacific, 1961–2003
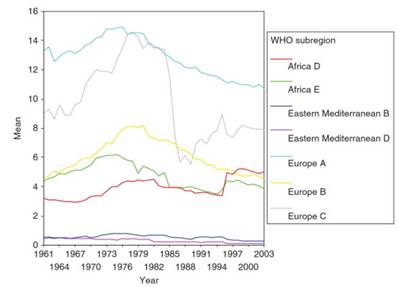
Figure 3. Adult per capita consumption in seven WHO subregions: Africa D and E, Eastern Mediterranean B and D, and Europe A, B, and C, 1961–2003
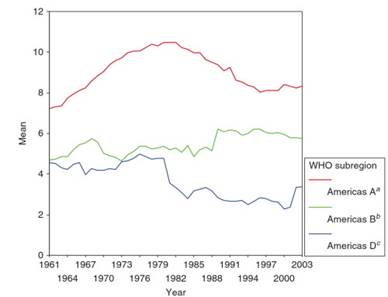
Figure 4. Adult per capita consumption in three WHO subregions: Americas A, B, and D, 1961–2003. A Canada, Cuba, United States of America. B Antigua and Barbuda, Argentina, Bahamas, Barbados, Belize, Brazil, Chile, Colombia, Costa Rica, Dominica, Dominican Republic, El Salvador, Grenada, Guyana, Honduras, Jamaica, Mexico, Panama, Paraguay, Saint Kitts and Nevis, Saint Lucia, Saint Vincent and the Grenadines, Suriname, Trinidad and Tobago, Uruguay, Venezuela. c Bolivia, Ecuador, Guatemala, Haiti, Nicaragua, Peru
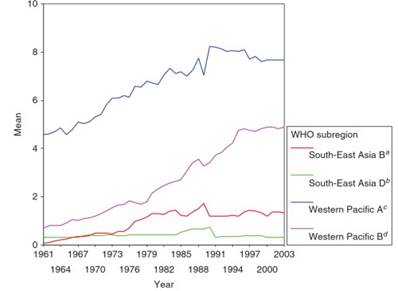
Figure 5. Adult per capita consumption in four WHO subregions: South-East Asia B and D, and Western Pacific A and B, 1961–2003. A Indonesia, Sri Lanka, Thailand. B Bangladesh, Bhutan, Democratic People’s Republic of Korea, India, Maldives, Myanmar, Nepal. C Australia, Brunei Darussalam, Japan, New Zealand, Singapore. D Cambodia, China, Cook Islands, Fiji, Kiribati, Lao People’s Democratic Republic, Malaysia, Marshall Islands, Micronesia (Federated States of), Mongolia, Nauru, Niue, Palau, Papua New Guinea, Phillipines, Republic of Korea, Samoa, Solomon Islands, Tonga, Tuvalu, Vanuatu, Vietnam
The average adult per capita consumption, including unrecorded consumption, for 2002 is compared by country in Figure 6, indicating how countries and regions differ in their overall consumption levels.Figure 7 illustrates the WHO subregions that show the typical pattern of alcohol consumption around the world for the year 2002. As can be seen, detrimental patterns of consumption are the norm in the vast majority of the developing world, which means that in those countries, there is no evidence that the population drinks at low-risk levels. Not surprisingly, there were no protective effects of low levels of alcohol consumption found for these countries.
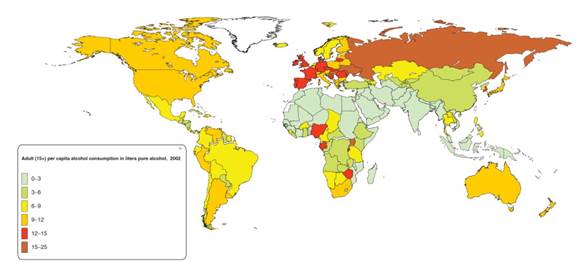
Figure 6. Adult per capita consumption including unrecorded consumption in 2002 (based on average 2001–03)
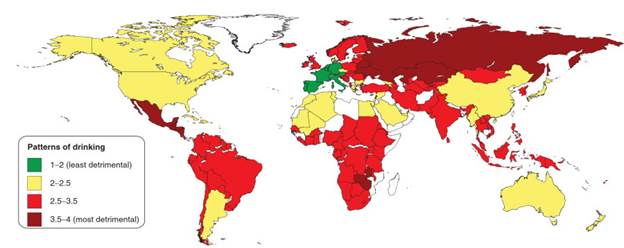
Figure 7. Patterns of drinking in 2002. From Rehm J, Patra J, Baliunas D, Popova S, Roerecke M, and Taylor B (2006) Alcohol consumption and global burden of disease 2002. Report to WHO. Geneva: World Health Organization
Age and gender. Information by age and gender is insufficient for international comparisons across time on volume or patterns of alcohol consumption. Only recently, internationally comparable data have been collected in different countries.
The ESPAD surveys in European countries, for example, which collected data in 1995, 1999, and 2003 among 13- to 15-year-old school children, indicated that lifetime use of alcohol (i.e., 40 times or more) has increased in several countries, as well as in the proportion of people who had been drunk 20 times or more in their lifetime (trends were not uniform across all participating countries).
Mortality data. Analysis of mortality data from alcohol-related causes indicated that alcohol is responsible for most deaths among young people aged 15-29 years (WHO, 2002), but it is unknown if this has increased over the years, is a new phenomenon, or has been happening for decades because the data have not been analyzed in such a way that would show alcohol as a key risk factor.
Date added: 2024-03-11; views: 828;