Bathymetrics. Seabed Visualization
Visualizing the sea floor began with single soundings made with a lead line and continued with simple echo sounders and contour maps drawn by hand. In one hour, an individual with a lead line could take twenty measurements in water 10 m (33 ft) deep, and in four hours only one measurement in water 4000 m (1 3,200 ft) deep; the echo sounder allowed 36,000 measurements to be made each hour in 10 m of water and 680 in the same time in 4000 m of water.
Today's multibeam sound systems can take 293,000 measurements per hour in 1 0 m of water and 20,000 measurements in 4000 m. Advances in multibeam sound system technology and improved computer graphics, combined with satellite navigation for precise positioning, are opening dramatic new windows to the sea floor.
A single sound beam device releases a cone of sound; as the depth of the water increases the area of the sea floor from which the echo is reflected also increases. Depth is averaged over the "footprint" of the sound beam, and therefore seafloor features smaller than the footprint are difficult to detect and detail is reduced. Two new technologies using multiple sound devices are being used to produce detailed, high-resolution seafloor maps: (1) side-scan acoustical imaging and (2) swath bathymetry.
Side-scan measurements can be made either from a surface vessel or from a submerged system towed behind a vessel. If the ship is pitching and rolling, the path of the sound beam from a surface vessel will be displaced from its intended direction, resulting in inaccurate data. A towed system is below the depth of surface waves and winds; it is also closer to the sea floor, allowing the use of a conical sound beam that produces a smaller sound footprint.
The smaller footprint increases the detail that is imaged but decreases the scanned area for each cone of sound. The area surveyed is increased by sending out multiple sound beams obliquely on either side of the sound device; no image is obtained from directly under the side scanner.
Side-scan acoustical images are the product of the reflectivity of the seafloor materials and the angle at which the sound beams strike the sea floor. Changes in the reflection of the sound come from the irregularities and the changing properties of the bottom being scanned. The sides of a seamount, a fault, and other objects with strong topographic relief act as good reflectors.
Side-scan sonar systems that are housed in torpedo-like casings and towed behind ships are known as towfish; GLORIA (geological long-range inclined asdic) is one of the most sophisticated. It is towed at 10 knots (nautical miles per hour), has a depth capability of 5000 m (16,400 ft), and scans the sea floor with two 30-km- (18-mi-) wide sound beams. The sound beams are composed of sound pulses that last four seconds, with forty-second intervals between pulses to allow the echo to return to the towfish for recording (box fig. 3.1).
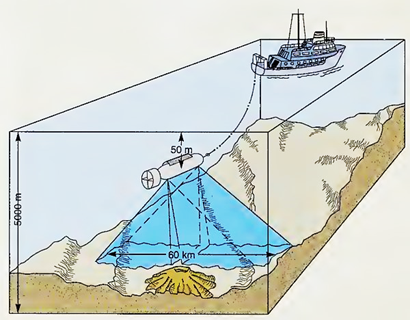
Box fig. 3.1. A surface vessel tows a side-scan sonar system, or towfish, to acoustically map a swath of sea floor. The dark triangle shows the area covered by the sound beams. Vertical scale distorted for clarity
Side-scan acoustical imaging also works very well to detect sunken ships, planes, or other structures, because the reflecting surfaces of these structures are at an angle to the sea floor, and their acoustical properties are very different from those of the sea floor. The object's shape is accompanied by an acoustical shadow (seen behind the plane in box fig. 3.2) that provides strong image definition and indicates elevation above the sea floor.

Box fig. 3.2. The image of a plane on the sea floor obtained by side-scan sonar. Note the shadow generated when sound was not returned from the seabed
The GLORIA surveys of the 1980s produced the first accurate maps of the deep sea floor within U.S. resource limits, but it was too slow and the sound beam was too narrow to obtain detailed information over the shallow continental shelves. In the 1 990s the USGS (United States Geological Survey) began a high-resolution survey of U.S. continental shelves using a system based on multiple sound sources known as swath bathymetry.
Swath bathymetry determines depth and produces images by analyzing the sound interference patterns between outgoing sound beams and returning echoes. This method uses hull-mounted sonar arrays of sixty to more than 1 50 electronically separated sound sources mounted along the length of the hull and multiple sound receivers mounted across the hull. Both sound sources and receivers are directed vertically downward.
The swath length is the length of the area returning echoes. The width of the swath is in the direction of the vessel's motion and is determined by the sound cone angle. A computer analyzes the sound interference patterns between outgoing sound pulses and their returning echoes. Once a computer image has been assembled, the image can be viewed from any angle and enhanced with color to indicate depth (refer to figure 1.13 in chapter 1). The ship is positioned by GPS, and measurements can be collected at vessel speeds in excess of 15 knots (17 mi /h).
Between 1994 and 1997 the USGS mapped five areas using swath bathymetry: Massachusetts Bay, parts of the continental shelf off New York, the Hudson River, the coastal margin of Santa Monica, and the central portion of San Francisco Bay. In 1998 the project continued, mapping portions of the slopes of the Hawaiian Islands and the shelf areas of San Diego and Newport, California.
The images obtained with these multibeam systems are providing highly detailed and accurate images of the sea floor, similar to those seen in aerial photographs. These maps are providing basic information, fundamental for geological research and biological management of the coastal margin.
Date added: 2023-11-08; views: 821;