Measuring the Depths. Depth recorder trace
In about 85 B.C. a Greek geographer named Posidonius set sail, curious about the depth of the ocean. He directed his crew to sail to the middle of the Mediterranean Sea, where they eased a large rock attached to a long rope over the side. They lowered it nearly 2 km (1.2 mi) before it hit bottom and answered Posidonius’ question. Crude as this method was, it continued with minor modifications as the means of obtaining soundings, or depth measurements, for the next 2000 years.
An early modification was the use of hemp line or rope with a greased lead weight at its end. This line was marked in equal distances (usually fathoms; a fathom is the length between a person’s fully outstretched hands, standardized at six feet). The change in line tension when the weight touched bottom indicated depth, and the particles from the bottom adhering to the grease confirmed the contact and brought a bottom sample to the surface.
This method was quite satisfactory in shallow water, and the experienced captain used the properties of the bottom sample to aid in navigation, particularly at night or in heavy fog. In deep water, however, the weight of the hemp line was so great that it was difficult to sense when the lead weight touched the bottom. The sediments adhering to the grease could still confirm a touch, hut there was no way of knowing how much slack line lay on the bottom. For this reason the deeper areas measured by this technique were often thought to be greater than their real depth.
Later, piano wire with a cannonball attached was used in deep water. The heavy weight of the ball compared with the weight of the wire made it easier to sense the bottom, but the time (eight to ten hours) to winch the wire out and in and the effort consumed for each measurement were so great that by 1895 only about 7000 depth measurements had been made in water greater than 2000 m (6600 ft) and only 550 measurements had been made of depths greater than 9000 m (29,500 ft) over all the world’s oceans.
It was not until the 1920s, when acoustic sounding equipment was invented, that deep-sea depth measurements became routine. The echo sounder, or depth recorder, which measures the time required for a sound pulse to leave the surface vessel, reflect off the bottom, and return, allows continuous measurements to be made easily and quickly when the ship is under way. The behavior of sound in seawater and its uses as an oceanographic tool are discussed in chapter 4. A trace from a depth recorder is shown in figure 3.1.
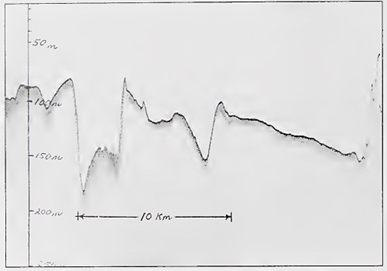
Fig. 3.1. Depth recorder trace. A sound pulse reflected from the ocean floor traces a depth profile as the ship sails a steady course. The horizontal scale depends on ship speed
In 1925 the German vessel Meteor made the first large-scale use of an echo sounder on a deep-sea oceanographic research cruise and detected the Mid-Atlantic Ridge for the first time. After this expedition, depth measurements gradually accumulated at an ever-increasing rate. As the acoustic equipment improved and was used more frequently, knowledge of the ocean floor’s bathymetry expanded and improved, culminating in the 1950s with the first detailed mapping of all the mid-ocean ridge and trench systems.
Today, a wide variety of methods is used to obtain even more detailed seafloor bathymetry at scales that range from centimeters (inches) to thousands of kilometers (thousands of miles). The specific technique used often depends on the amount of time that can be spent, the scale of the feature that is being examined, and the amount of detail that is required. When necessary, direct observation of small-scale structures is possible with the use of manned submersibles and remotely operated vehicles (ROVs) carrying video cameras whose images can be transmitted to surface ships and relayed by satellite anywhere in the world in real time (fig. 3.2).
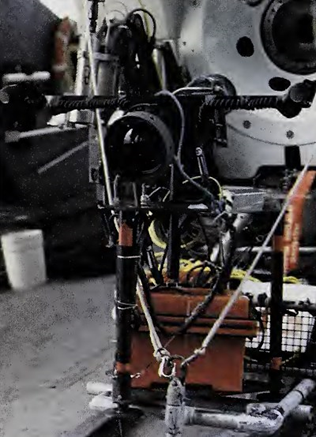
Fig. 3.2. This internally recording television camera is placed on the sea floor, where it automatically photographs events until it is retrieved by the researchers. The red box contains the camera’s power supply
Investigations by manned submersibles or ROVs provide great detail, but they typically cover very small areas and are both time-consuming and expensive for the amount of sea floor surveyed. On large scales of tens or hundreds of square kilometers, sophisticated multibeam sonar systems can rapidly map extensive regions at relatively low cost with great accuracy (see fig. 1.13 in chapter 1).
A new system has been developed for making detailed bathymetric surveys in shallow coastal water using an airborne laser. The laser airborne depth sounder (LADS) system is flown in a small fixed-wing aircraft 350-550 m (1200-1800 ft) over the surface; the exact position of the aircraft is determined by the Global Positioning System (GPS). The laser is used to measure the distance between the aircraft and the sea floor. The LADS system can take up to 900 soundings per second (3.24 million soundings per hour). Individual measurements typically are taken on 5 x 5 m (16.5 X 16.5 ft) spacing in a swath 240 m (790 ft) wide along the survey line.
For greater detail, the spacing can be reduced to 2 X 2 m (6.5 X 6.5 ft). Because light is rapidly attenuated in water, LADS has an operational depth range of 0.5-70 m (1.5-230 ft). The actual maximum depth in a specific area depends on water clarity. In pristine coral reef environments, soundings as great as 70 m (230 ft) can be obtained, whereas in clear to moderately turbid coastal waters the effective depth of penetration decreases to 20-50 m (66-164 ft). In very turbid water, the system is restricted to 0-15 m (0-49 ft).
Very-large-scale seafloor surveys use satellite measurements of changes in sea-surface elevation caused by changes in the Earth’s gravity field due to seafloor bathymetry. These changes in sea-surface elevation can be detected by radar altimeters that measure the distance between the satellite and the sea surface. The sea surface is not flat even when it is perfectly calm. Changes in gravity caused by seafloor topography create gently sloping hills and valleys in the sea surface.
The excess mass of features such as seamounts and ridges creates a gravitational attraction that draws water toward them, resulting in an elevation of the sea surface. Conversely, the deficit of mass along deep ocean trenches, and subsequent weaker gravitational attraction, results in a depression of the sea surface as water is drawn away toward surrounding areas with greater gravitational attraction. Sea level over large seamounts is elevated by as much as 5 m (16 ft) and over ocean ridges by about 10 m (33 ft); it is depressed over trenches by about 25-30 m (80-100 ft).
These changes in elevation occur over tens to hundreds of kilometers, so the slopes are very gentle. The sea surface is always perpendicular to the local direction of gravity, so precise measurements of the slope of the surface can be used to determine the direction and magnitude of the gravitational field at any point. Because these changes in gravity are related to seafloor topography, it is possible to use them to reconstruct what the bathymetry must look like to produce the observed variations in sea-surface topography (fig. 3.3).
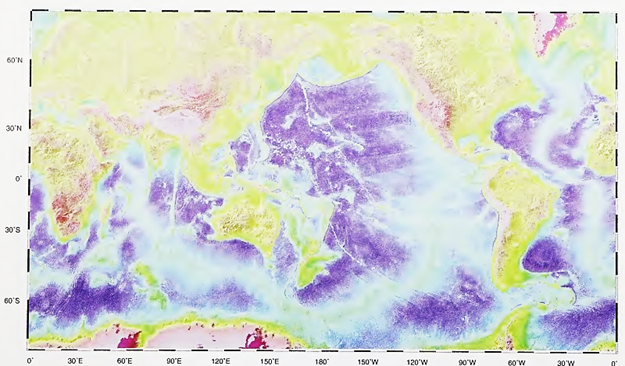
Fig. 3.3. Color-shaded relief image of the bathymetry of the world’s ocean basins modeled from marine gravity anomalies mapped by satellite altimetry and checked against ship depth soundings
Tides, currents, and changes in atmospheric pressure can cause undulations of more than a meter (3 feet) in the ocean surface. These effects are filtered out to produce the bathymetric details. Bathymetric features with “footprints,” or horizontal dimensions as small as about 10 km (6.2 mi), can be resolved with satellite altimetry data. Satellite maps are particularly valuable in the Southern Ocean, where the weather and sea conditions are frequently bad and it is difficult to conduct general bathymetric surveys to locate areas of scientific interest.
Date added: 2023-11-08; views: 829;