Perturbations in Global Weather - Storms at Sea
Although it is the general circulation of the earth's atmosphere that is responsible for the large-scale circulation and surface circulation of the world ocean, it is departures from the general pattern that produce many of the features of the ocean that we observe. The most profound of these departures are storms.
It is storms that produce the high winds and large waves that hamper shipping, attach our coasts, and make life miserable for sailors and oceanographers at sea. Storm waves create the most dramatic and rapid changes in the configuration of our coastlines and beaches. Such waves are of concern to engineers that design coastal and offshore structures and to shipping companies that plan optimium routes for their vessels. Storm waves cause the intense mixing in the surface water that triggers the annual productivity cycle described in a later chapter.
Major storms at sea are of two types: extratropical and tropical. Extratropical storms are prominent in winter weather patterns in the temperate latitudes of the earth. Tropical storms, called hurricanes, cyclones, or typhoons (from the Chinese tai fung, meaning supreme wind), occur in the part of the tropics lying more than 5° of latitude from the equator.
Extratropical Storms. These storms usually form at the polar front where cold, dense polar air moving southwestward meets warm temperate air moving northeastward. A perturbation at the polar front can cause the development of a local low pressure zone as shown in Fig. 7-13A and B. The perturbations are caused by ordinary variations in the winds near the polar front or by variations caused by coastlines, especially coastal mountains.
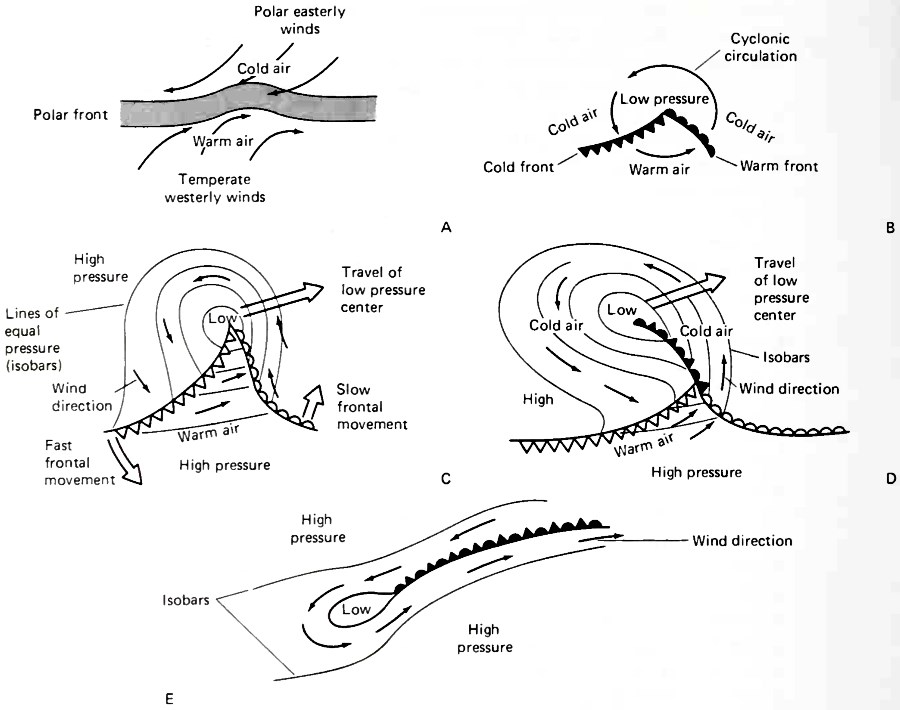
Figure 7-13. Formation and development of extratropical storm winds in the northern hemisphere. (A) A perturbation in the wind field occurs at the polar front. (B) Cyclonic circulation begins and the cold and warm fronts form. (C) The cold front begins to overtake the warm front. (D) Formation of an occluded front. (E) Complete occlusion and deterioration of the storm system. The wind speed is proportional to the spacing between isobars. Close spacing corresponds to high wind speeds. (Used with permission of McGraw-Hill, Inc.)
A local cyclonic circulation develops around a pressure low (Fig. 7-13B). Cyclonic circulation is clockwise in the southern hemisphere and counterclockwise in the northern hemisphere. A cold front separating the intruding polar air from temperate air extends from the pressure low for 500 to 3,000 km. A warm front develops where temperate air is shoved over a wedge of dense polar air by the cyclonic circulation.
The cold front rotates about the low pressure center faster than the warm front does (Fig. 7-13C), so eventually it overtakes the warm front and forms an occluded front (Fig. 7-13D). If the air behind the cold front becomes warmed slightly, the cold front rides up over the cold polar air beyond the warm front and the occluded front that forms is of the warm type. If on the other hand the intruding polar air remains relatively frigid, it intrudes into air lying beyond the warm front, lofts the warm front, and forms a cold-type occluded front at the sea surface (Fig. 7-14).
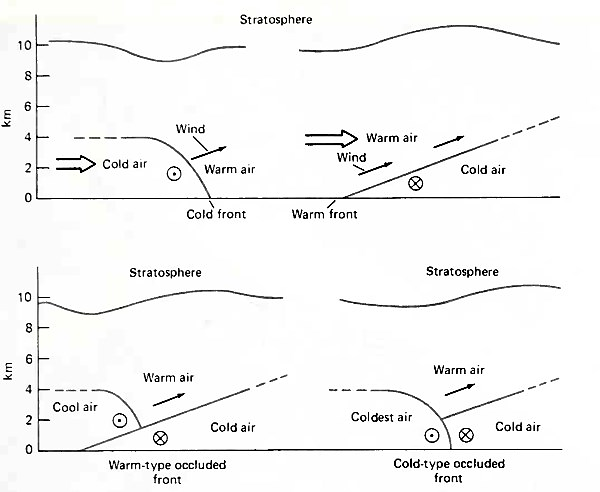
Figure 7-14. Front profiles looking north or east in northern hemisphere. The symbol  represents wind blowing at the observer,
  represents wind blowing away from the observer. (Used with permission of McGraw-Hill, Inc)
The low pressure center moves generally westward in both hemispheres. Its rate of travel is intermediate between the wind speeds in the cold air and those in the warmer air but closer to those in the warmer air. During its travel the occluded front extends farther and farther until the low pressure cell is completely surrounded by cold air, and the warm air is lofted so high that it chills, falls, and mixes with the cold air. The pressure in the center becomes less distinct from that of the surrounding air and the storm system dissipates (Fig. 7-13E).
The severity of the storm is determined by the contrast between pressures in the low and in surrounding air. Wind speeds of 140 kph (75 kts) are not uncommon. The storms are most frequent in the winter when temperature contrasts across the polar front are at a maximum. The winds associated with these storms produce winter waves. Summer swells in the northern hemisphere are produced in the southern hemisphere where it is a time of winter storms.
The paths of the low-pressure centers are governed by the distribution of high-pressure systems surrounding them. High-pressure cells over deserts on land or in lower temperate regions are particularly effective in steering their motion.
The fronts that sweep cyclonically around the low-pressure (Fig. 7-15) centers extend equatorward as far as 15° latitude (in extreme cases). The passage of a cold front or especially of an occluded front is marked by a sudden change in wind direction and in wind speed. The winds experienced at a fixed site at sea during frontal passage are shown in Fig. 7-16.
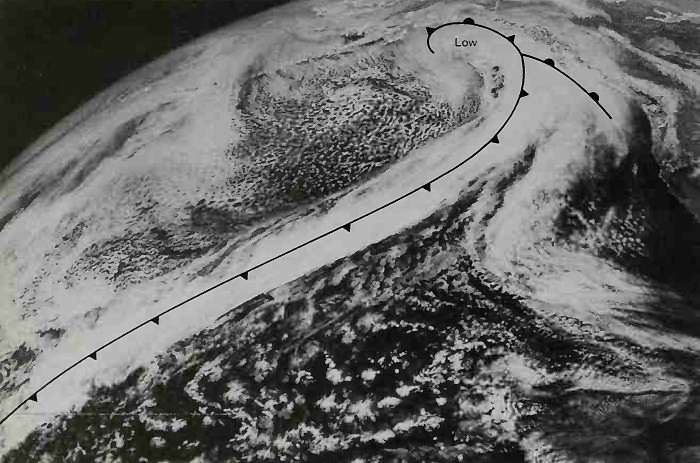
Figure 7-15. Satellite photo of an extra tropical cyclone with well-developed cold front and occluded front. Area is the Gulf of Alaska and the Northeast Pacific Ocean, March 10, 1977. (NOAA Photo)
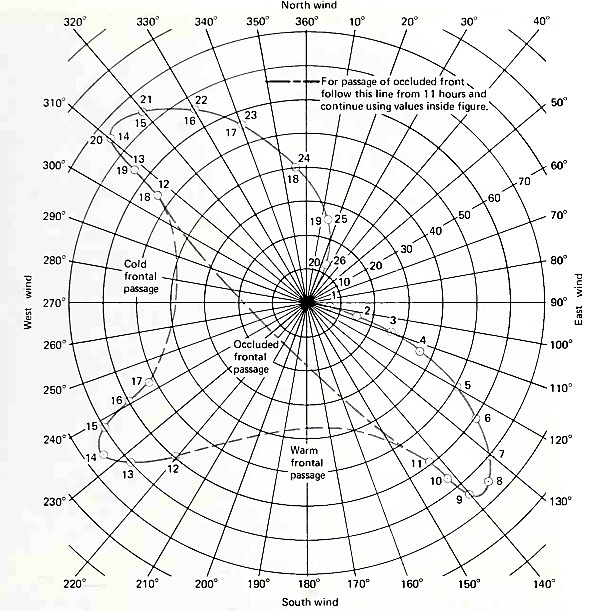
Figure 7-16. Diagram showing the wind speed and direction from which the wind blows at each hour during a frontal passage at hours 11 to 12. The site of observation is at the center of the diagram. This diagram represents an idealized northern hemisphere extratropical storm system bearing winds at 140 km per h. (From: Oceanographic Service, Inc., Goleta, CA)
Tropical Storms. The most severe storms of the world ocean are the tropical cyclones. They bear different names in various ocean basins, but their genesis and morphology are the same. In the Atlantic they are hurricanes, in the Pacific, typhoons, and in the Indian Ocean, cyclones. They are called Willy Willy in Australia and Baguio in the Philippines.
These storms form where trade winds from one hemisphere of the earth are diverted to meet the trade winds of the opposite hemisphere. Diversion is usually produced by a continental mass and the seasonal shift of the global pattern of air circulation; the monsoon winds are also instrumental in the western Pacific and Indian ocean basins.
The boundary between the northeast trade wind belt and the southeast trades shifts north and south seasonally as shown in Fig. 7-17. The boundary is usually in the northern hemisphere except m the western Pacific and Indian oceans in February. Wherever the trade winds cross the equator, the Coriolis force deflection reverses. In areas where tropical storms generate, the deflection reversal is severe enough to bring the trade wind from both hemispheres into virtual opposition.
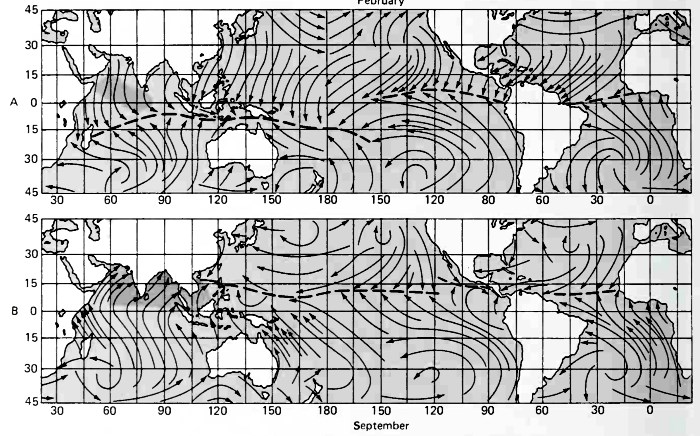
Figure 7-17. The winds over the world ocean during the tropical storm seasons of the (A) southern and (B) northern hemispheres. The dashed lines represent the boundary between the northeast and southeast trade wind belts. The shaded area shows the area of influence of the monsoons upon trade wind circulation. (After Byers, General Meteorology, Courtesy McGraw-Hill)
Tropical cyclones form when a perturbation of the wind field is caused by a shear-produced eddy or by a disturbance in the upper atmosphere. This leads to a local lowering of the barometric pressure at sea level that causes a convergence and attendant rising of air warmed at the surface of the ocean. A cyclonic circulation develops rapidly as the rising air lowers the barometric pressure even more.
Air sweeps inward and upward in an ascending helix until wind speeds exceeding 300 kph are developed. The fastest winds at the sea surface travel in a circular band surrounding an "eye” of exceedingly low pressure and light variable winds. The eye is from 10 to 30 km in diameter; most are usually about 25 km in diameter. The band of extreme winds is from 300 to 400 km wide. A satellite photo of such a storm system is shown in Fig. 7-18.
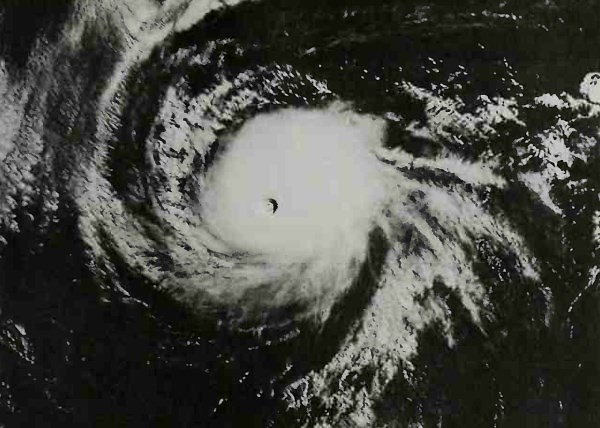
Figure 7-18. Satellite photo of tropical storm. The eye at the center of low pressure is clearly visible. (NOAA Photo)
The areas where tropical cyclones form, their time of maximum occurrence, and the regions affected by these storms are given in Table 7-1. The parts of the world ocean affected by tropical cyclones are shown in Fig. 7-19.
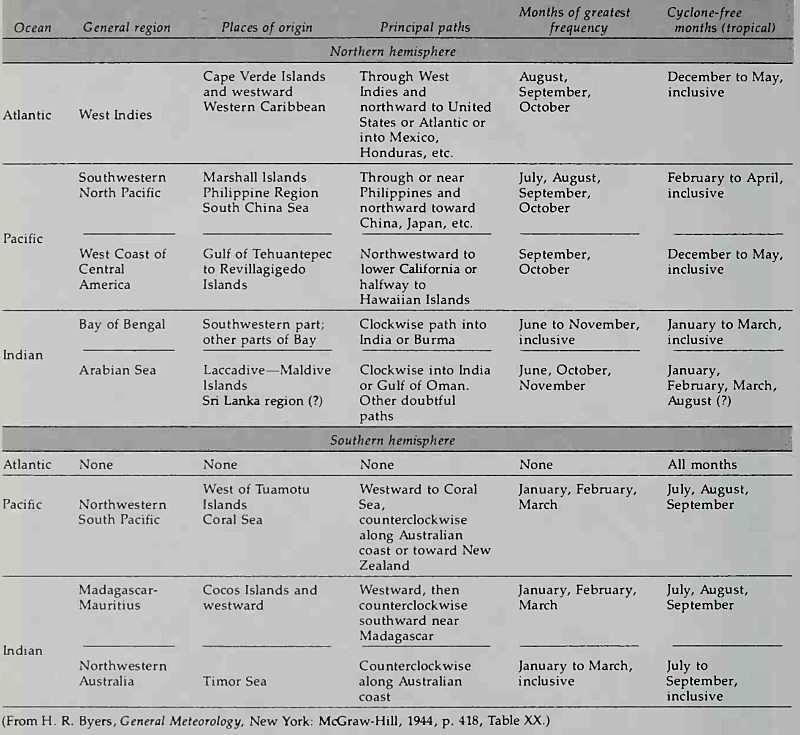
Table 7-1. Distribution of Tropical Cyclones in the World Ocean
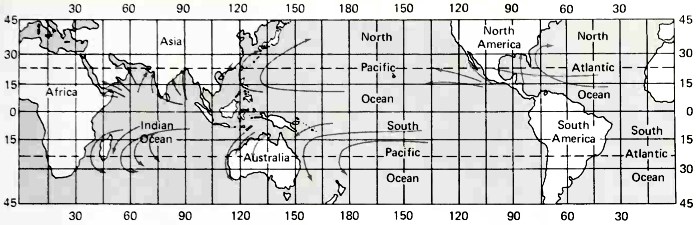
Figure 7-19. Paths of tropical cyclones in the world ocean. Note that no tropical cyclones occur between 5°N and 5°S latitudes. (From Byers, General Meteorology, courtesy McGraw-Hill)
Once formed, the tropical cyclone drifts westward enclosed in the trade wind belt. Its rate of travel is on the order of 10 to 30 kph. As the storm progresses, its rate of travel increases. Eventually it moves poleward with the global atmosphere circulation pattern, and its speed and direction of travel become erratic (see Fig. 7-20). Occasionally the eye becomes stationary for several hours, moves in a looping path, or speeds along at 90 kph.
When the tropical cyclone reaches land or moves into a region of relatively cold surface water it loses energy. Frictional retardation at the land surface (which is three to ten times as rough as the sea surface) slows the winds, and surrounding air is drawn into the eye. The pressure in the eye rises and the storm dissipates. Over cold water the storm is deprived of the thermal energy (latent heat of condensation) that drives it, and it begins to dissipate, although not as rapidly as over land.
The circular winds in the tropical cyclone generate waves that move radially away from the eye. The waves moving from the forward right quadrant of the storm (in the northern hemisphere) tend to be greatest because they are longest under the influence of the wind.
At a site in the path of a tropical cyclone the winds build rapidly at first; they build less rapidly as maximum winds approach. The wind dies abruptly as the eye passes, and then maximum winds from the opposite direction spring up as abruptly as the eye moves away. The winds decrease gradually until the storm has passed well away from the site. The behavior of the wind at such a site is shown by the diagram in Fig. 7-21.
Not all perturbations creating local low pressure in the generating regions of tropical cyclones reach intensities that merit the title of hurricane or typhoon Far more of these disturbances do not bear winds exceeding speeds of 65 kph (34 kts): Such systems are called tropical depressions. Systems with winds from 65 to 120 kph (35 to 65 kts) are called tropical storms.
Local Winds at Coasts. The coast represents a zone of transition between terrestrial winds and maritime winds. The physiography of the coast often alters the regional wind field (Fig. 7-22) to produce increased wind speeds or calm areas. The change in the frictional roughness of the surface over which the air moves causes rapid changes in the wind speeds as they pass to or from the sea.
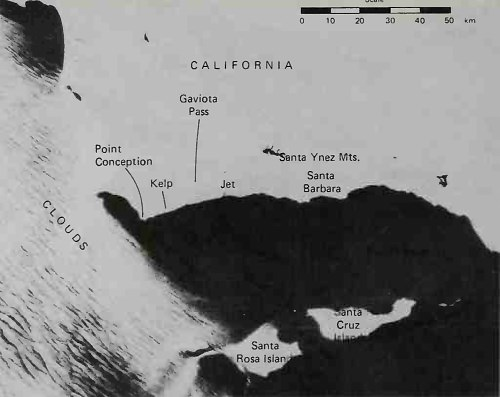
Figure 7-22. Satellite image of a part of the coast of southern California. A northwest wind curves around the mountainous headland at Point Conception. Air accumulates north of the mountains and a jet of wind spills through Gaviota Pass. The high winds roughen the sea surface, increasing its specular reflections. The path of the wind and the Gaviota wind plume are clearly visible. (From: Oceanographic Services, Inc./NASA)
In regions with mountainous coasts the regional air circulation accumulates air up to elevations of the major mountain passes. Air spills through the passes in the mountains and descends the leeward slope to the sea as jets of high velocity wind. Frequently the air is warmed as it descends to regions of lowered pressure. The variety of names given to this orographic circulation is presented in Table 7-2.
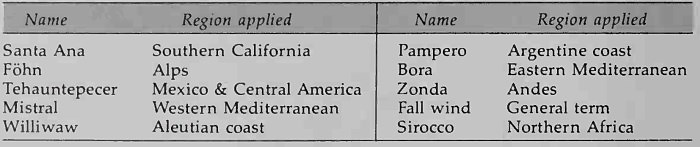
Table 7-2. Orographic Winds
Waterspouts. The marine equivalent to the tornado is the waterspout. This funnel of rapidly rotating winds develops in unstable air that accompanies the squall line associated with cold fronts. Water is drawn up into the funnel, hence the name. Although awesome in appearance, a waterspout seldom causes damage because it is relatively rare at sea or it dissipates quickly upon reaching shore.
Date added: 2024-04-08; views: 708;