Microplastics: A Global Water Pollution Problem. Magnitude of Plastic Production and Waste
Introduction. Plastic debris is an increasing environmental threat to the natural beauty, landscape, and ecosystem in coastal areas. As a manufacturing material, plastic has been mass-produced and used in several industries for the past 70 years. The unique properties of plastics (e.g. durability, flexibility, strength, low density, impermeability to a wide range of chemical substances, and high thermal and electrical resistance) have made them a viable alternative for several traditional manufacturing materials. Most manufactured plastics are extremely durable and can persist in the environment for several decades.
This, in addition to insufficient solid waste management infrastructure, outpaced by exponential plastic production, and the mismanagement of this waste, has led to the concurrent accumulation of plastic litter in the environment. Recent advances in technology have led to the production of more degradable and compostable plastic polymers (e.g. polylactic acid); however, these new polymers have not yet had a measurable impact on the overall hazards that plastic debris poses to the environment.
One such hazard posed by the millions of tons of plastic litter in aquatic environments is its fragmentation into microscopic pieces commonly referred to as microplastics. Today, microplastic particles are ubiquitous in all environmental compartments (e.g. air, water, sediment, and biota). This article will examine the magnitude of plastic production and waste, provide an overview of the major sources of microplastics in the aquatic environment and the hazards they pose to both environmental and human health, and describe ongoing efforts to characterize the sources and fate of microplastic contamination in Charleston Harbor, SC, USA.
Magnitude of Plastic Production and Waste. On an annual basis, the global production of plastic is nearly 350 million metric tons, of which approximately 50% are single-use disposable plastic items such as packaging and consumer goods. Manufactured plastics include more than 20 families of polymers with six types - polypropylene (PP), high- and low-density polyethylene (HDPE and LDPE, respectively), polyvinyl chloride (PVC), polyurethane (PUR), polyethylene terephthalate (PET), and polystyrene (PS) - accounting for around 80% of the production. To date, greater than 8.3 billion metric tons of plastic have been produced, and by 2050, it has been estimated that the cumulative global production of plastic materials will exceed 33 billion metric tons.
Currently, the top five producers of plastic are China, Indonesia, Philippines, Vietnam, and Sri Lanka, which collectively account for >54.5% of the total global plastic production. Perhaps more importantly, these top five producers mismanage 76-88% of their plastic waste. By comparison, the United States annually produces 44.5 million metric tons, while mismanaging an estimated 2% of its plastic waste. However, it is important to note that, with the exception of Sri Lanka, the U.S. produces the most plastic waste per capita and has a per capita rate that is 2.3 times greater than that of China.
Approximately 8 million items of litter enter the marine environment every day, with 70% ending up in sea beds, 15% on beaches, and the remaining 15% floating on the surface. An estimated 80% of marine debris is from land-based sources, while 20% is from sea-based sources such as discarded fishing gear. Plastics make up about 60-80% of this marine debris. Annually, an estimated 8-12.7 million tons of plastic debris enter the world’s oceans. On the ocean’s surface, Eriksen et al. estimated that there are 5.25 trillion plastic particles afloat weighing more than 268 000 tons, which represents 0.1% of the global annual production. On beaches, all top 10 items found in debris are single-use plastic items and include cigarettes (e.g. the cellulose acetate used in filters is plastic), food wrappers, caps and lids, beverage bottles, bags, straws, and foam take-out containers (Table 1). Collectively, plastic items comprise >78% of all marine debris reported on beaches.
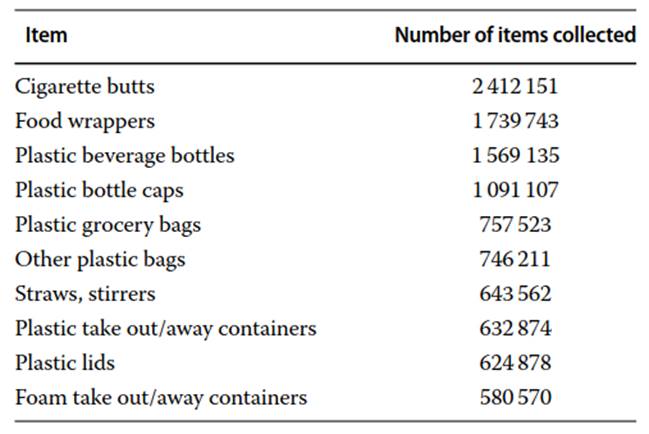
Table 1. Top 10 items collected on beaches during the Ocean Conservancy's International Coastal Clean-up event in 2017
Plastic debris afloat in the ocean is subject to widespread transport due to the influence of winds and currents. This has been best documented in the northern Pacific Ocean where the northeast trade winds and westerlies, in combination with the sinking of North Pacific Deep Water from the Arctic, form the North Pacific Subtropical Gyre. Plastic debris accumulates in the center of this gyre, which has been referred to as the Great Pacific Garbage Patch, or Eastern Garbage Patch (Figure 1). Other ocean gyres also concentrate plastic debris in a similar fashion, but the Great Pacific Garbage Patch is the largest. Dispersal of plastic debris among hemispheres and some ocean gyres is possible given their buoyancy and the influence of winds and currents.
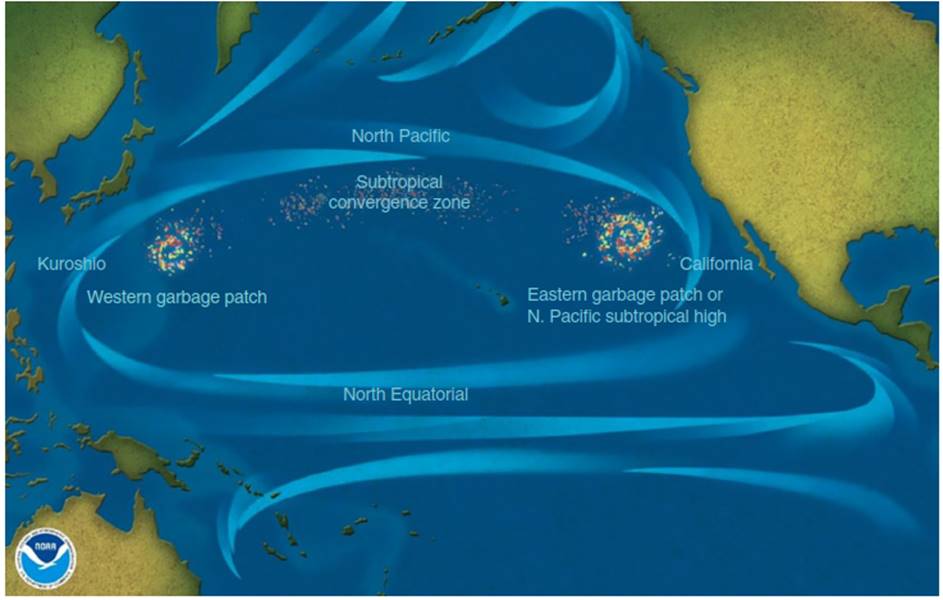
Figure 1. Illustration of the location of the Eastern and Western Garbage Patches in the Pacific Ocean. The Eastern Garbage Patch is the largest and commonly referred to as the "Great Pacific Garbage Patch”. Source: Reproduced with permission from NOAA
Plastic debris can be categorized into three size classes: macroplastics (>25mm), mesoplastics (5-25 mm), and microplastics (<5mm). The majority of plastic particles afloat in the ocean are microplastics, comprising as much as 92.4% of the total plastic. Oceanographic models of plastic debris distribution estimate that the global sea surface currently contains between 15 and 51 trillion microplastic particles (>0.15 mm) weighing between 93 000 and 236000 metric tons. In the Mediterranean Sea, concentrations as high as 890 000 particles km-2 have been documented, with the vast majority of the particles being microplastics. In addition to being present on the surface of every ocean, microplastics have been observed in deep sea sediments, Arctic sea ice, urban beach sediments, freshwater lakes and rivers [20], and remote uninhabited islands.
Microplastic particles can be of primary or secondary origin, and like many environmental contaminants, they can enter aquatic systems through both point and nonpoint sources. In general, point source pollution comes from a single, identifiable source such as a municipal wastewater treatment plant (WWTP) or industrial discharge pipe, whereas nonpoint source pollution comes from diffuse sources over a broad area such as stormwater runoff. Primary microplastics are intentionally manufactured to be small and are most commonly produced in the shape of beads (e.g. microbeads), capsules, and pellets.
Microbeads are used in cosmetics and personal care products, such as facial creams, cosmetics, and toothpastes. In the United States, the Microbead-Free Waters Act of 2015 prohibited the addition of plastic microbeads in certain personal care products in an effort to reduce further contamination of the environment by these products. Primary microplastics are also used in industry for abrasive blast cleaning, in pharmaceuticals for drug delivery, and in manufacturing as preproduction pellets. Primary microplastics can enter aquatic environments directly through point sources and through accidental spillage.
Secondary microplastics are produced through the degradation of larger plastic items as they degrade over time, and this is considered to be the main source of microplastic contamination in the marine environment. Other sources of secondary microplastics include the abrasion of plastic products and paints, discarded/lost fishing equipment, synthetic fibers from textiles, and the abrasion of tires on the road surface. Thus, microplastic contamination in the marine environment is largely considered to come from diffuse, nonpoint sources.
Date added: 2025-02-13; views: 475;