Climate Variability. Floods, Droughts, and Heat Waves
Floods, Droughts, and Heat Waves. Climate is often described in terms of climatic means, typically defined by 30-year averages. For example, the mean temperature for the month of July in central England during the period 1971-2000 was 16.5°C (Figure 7.1a). However, the monthly temperature varied considerably from this 30-year mean in any given year. The minimum monthly temperature during the 30-year period was 14.7°C; the maximum was 19.5°C. The average temperature was realized in only two years.
The July temperature was below average in 16 years and above average in 12 years. Temperature in five years was one or more standard deviations (1.3°C) below average and more than one standard deviation above average in another five years. An extended temperature record for central England over a 347-year period further illustrates the nature of climate variability (Figure 7.1b). Between 1659 and 2005, July temperature averaged 16.0°C but ranged from a high of 19.5°C to a low of 13.4°C. As seen in the 30-year running mean temperature, there have been distinct periods of warming and cooling in central England.
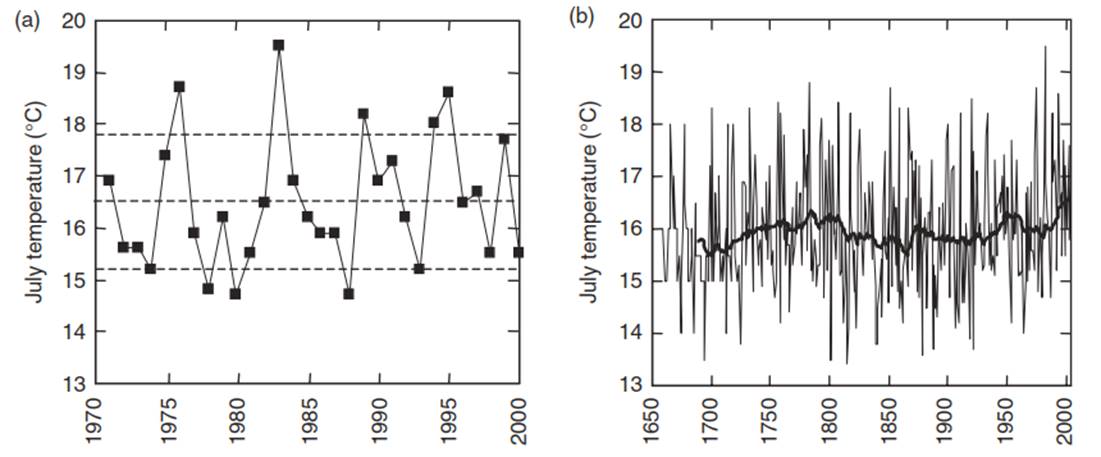
Fig. 7.1. Mean monthly July temperature measured in central england. (a) Temperature for 1971–2000, with dashed lines denoting the mean and one standard deviation. (b) Temperature for 1659–2005. The thick solid line shows the 30-year mean temperature. Data provided by the Hadley Centre (met Offi ce, exeter, UK). manley (1974), Parker et al. (1992), and Parker and
Horton (2005) describe this temperature record
Precipitation also varies from year to year. The summer of 1993 brought severe flooding in Midwest United States (Changnon 1996). Over 7 million hectares (ha) of land (1 ha =10,000 m2) were flooded, causing 15-20 billion U.S. dollars in damage and forty-eight deaths. At St. Louis, Missouri ) the Mississippi River was above flood stage for eighty days and above record flood stage for twenty-three consecutive days. At Davenport, Iowa, the river was above flood stage for forty-three days. Many of the large rivers that flow into the Mississippi also experienced major flooding. During this period, the northern and central Plains states and Midwest states received much more precipitation than normal (Figure 7.2). Precipitation from June to August was more than 100-200 mm above normal in a wide region and was more than 300 mm above normal in a smaller region centered on Iowa.
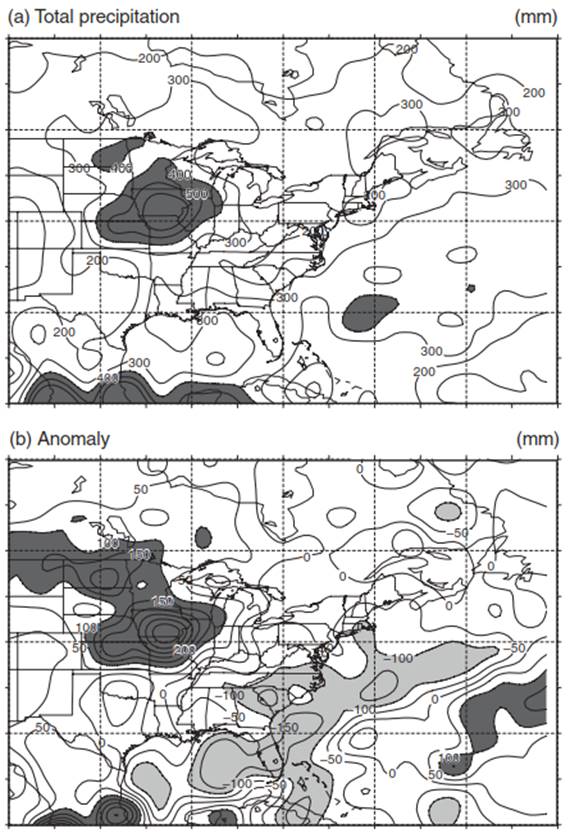
Fig. 7.2. Precipitation for the June–august 1993 summer season. (a) Total precipitation. Regions with greater than 400 mm precipitation are shaded. (b) Departure from normal. Regions more than 100 mm above normal are darkly shaded. Regions more than 100 mm below normal are lightly shaded. Data provided by the national Center for atmospheric Research (boulder, Colorado)
In addition to floods, central and western regions of the United States are prone to recurring droughts (Figure 7.3). The summers of 1934, during the infamous Dust Bowl, and 1956 were two of the most extreme drought years in the 1900s. In these years, extensive portions of the central Plains and West experienced extremely dry soils with a Palmer Drought Severity Index of -4 or less. The summer of 1988 was also a severe drought that caused 40 billion U.S. dollars in damage and 5000-10,000 heat-related deaths (Riebsame et al. 1990). These three drought years contrast with the widespread surplus of moisture in the summer of 1993. A 1930s magnitude Dust Bowl drought has occurred once or twice a century over the past three to four hundred years (Karl and Koscielny 1982; Woodhouse and Overpeck 1998), and multiyear droughts are common in western United States over the past millennium (Cook et al. 2004; Herweijer et al. 2007) . Droughts persist longer in interior portions of the country than in areas closer to the coasts (Karl and Koscielny 1982 ; Diaz 1983; Karl 1983).
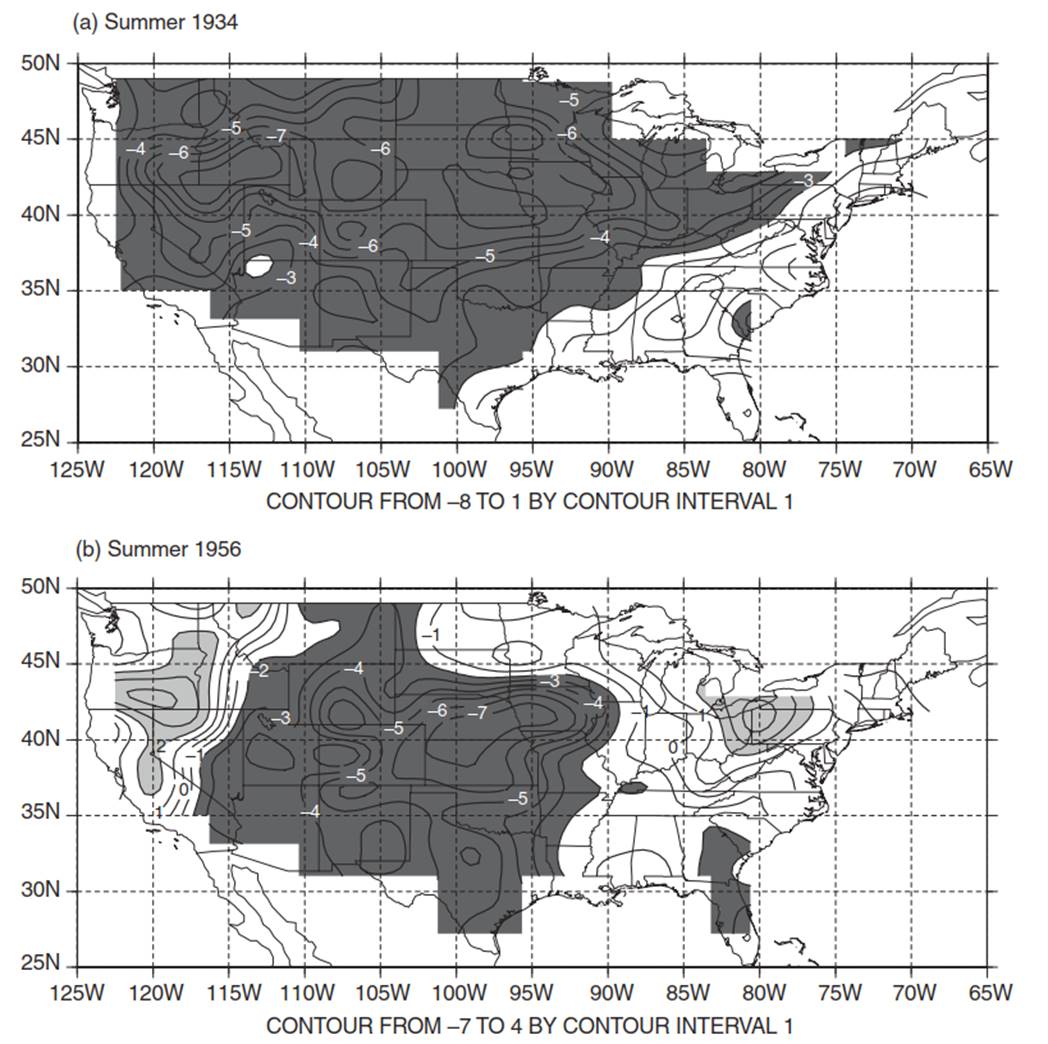
Fig. 7.3. Summertime Palmer Drought Severity index for the years (a) 1934, (b) 1956, (c) 1988, and (d) 1993. Values between –2 and +2 indicate near normal moisture conditions. Values less than –2 indicate increasing severity of drought and are darkly shaded. Values greater than +2 indicate increasing moisture surplus and are lightly shaded. Data from Cook et al. (1999) and provided by the national Geophysical Data Center (national Oceanic and atmospheric administration, boulder, Colorado)
Variation in temperature and precipitation from year to year are a manifestation of naturally occurring climate variability. The atmosphere is a chaotic system in which small-scale atmospheric events may have large-scale consequences. This chaotic behavior has been aptly characterized by the infamous butterfly effect by which a butterfly flapping its wings in Asia can cause events affecting weather over the United States (Lorenz 1993). Chaos theory puts a limit on the predictability of weather beyond several days because forecasters can never precisely know all the conditions affecting weather. However, over longer timescales of seasons some general patterns are evident. In particular, tropical atmospheric circulation and precipitation are strongly linked to the temperature of the underlying sea surface in a mode of variability known as the El Nino/Southern Oscillation (ENSO).
These changes in tropical circulation and precipitation influence seasonal temperature and precipitation throughout the world. The changes in climate and weather created by El Nino and La Nina can have devastating socioeconomic consequences. Events in the North Atlantic greatly affect winter temperature and precipitation in a broad region from North America to Europe and Asia through the North Atlantic Oscillation (NAO).
Date added: 2025-05-15; views: 495;