Anthropocene Impact: RCP Scenarios, CO2 Emissions & Human Land Use Dynamics
Anthroposphere. The world’s population in 2005 was estimated to be 6.5 billion people. This is more than a sevenfold increase from that prior to the industrial era, and population is expected to increase further to 8-10 billion by 2050 (Figure 2.6). The ever increasing spread of humanity across the planet has lead to growing recognition of people as agents of environmental change (Vitousek et al. 1997; Foley et al. 2005). Very little of the planet is untouched in some form by human activities.
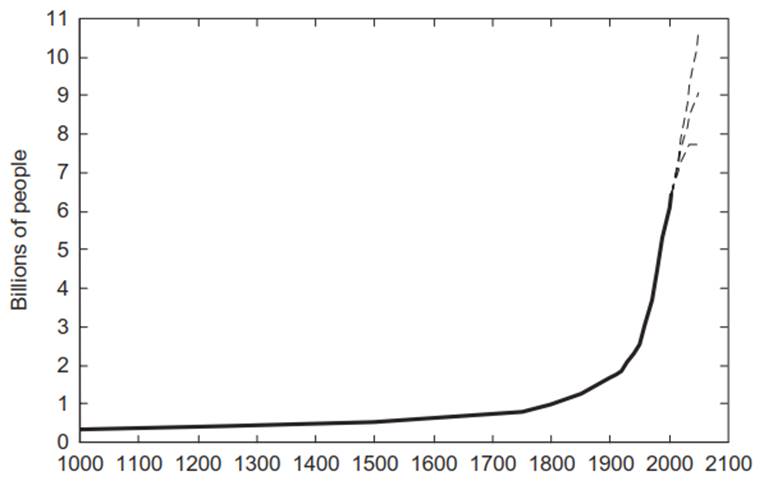
Fig. 2.6. World population from 1000 CE to 2005. projected population through 2050 is shown for low, medium, and high growth (dashed lines). Data provided courtesy of the population Division, Department of Economic and Social Affairs, United nations Secretariat
The anthroposphere represents humankind, our socioeconomic systems, and our activities. It is our cities, towns, and villages; the agriculture, energy, and water to sustain the populace; our transportation systems; and our collective influence on the environment. One of the more prominent anthropogenic effects is the emission of CO2 to the atmosphere from fossil fuel combustion (Figure 2.7).
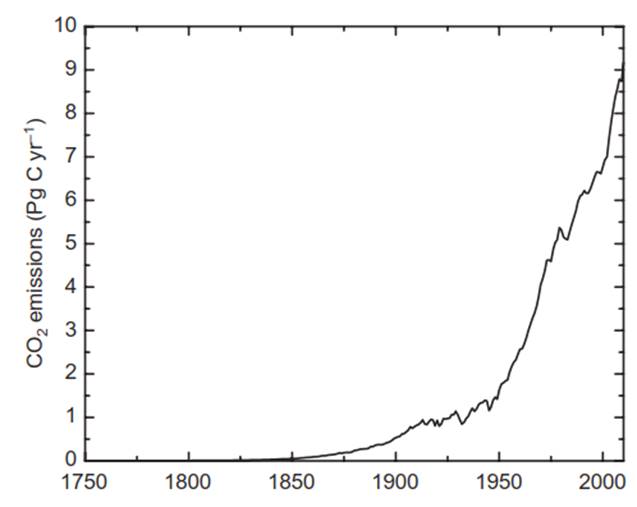
Fig. 2.7. World CO2 emissions from fossil fuel combustion and cement production. Andres et al. (2012) describe the data. Data provided by the Carbon Dioxide Information Analysis Center (Oak Ridge National Laboratory, Oak ridge, Tennessee)
This CO2 emission has increased to more than 9 Pg C yr-1, and atmospheric CO2 concentration has increased as a result. The outcome of human activities on planetary functioning is also seen in the elevated levels of atmospheric CH4, N2O, and other greenhouse gases over the preindustrial era; by increasing emissions and subsequent deposition of reactive nitrogen; and through land use practices such as agriculture, deforestation, afforestation, and reforestation. By altering biogeochemical cycles, the hydrologic cycle, and energy fluxes, human activities have a significant impact on climate. Inclusion of past and future changes in human activities is an important component of climate change simulations.
Over the past 300 years, human uses of land removed 7-11 million km2 of forest worldwide (Foley et al. 2005). Managed forests replaced an additional 1.9 million km2 of natural forest land. Presently, croplands and pastures cover more than one-third of the land surface (Figure 2.8).
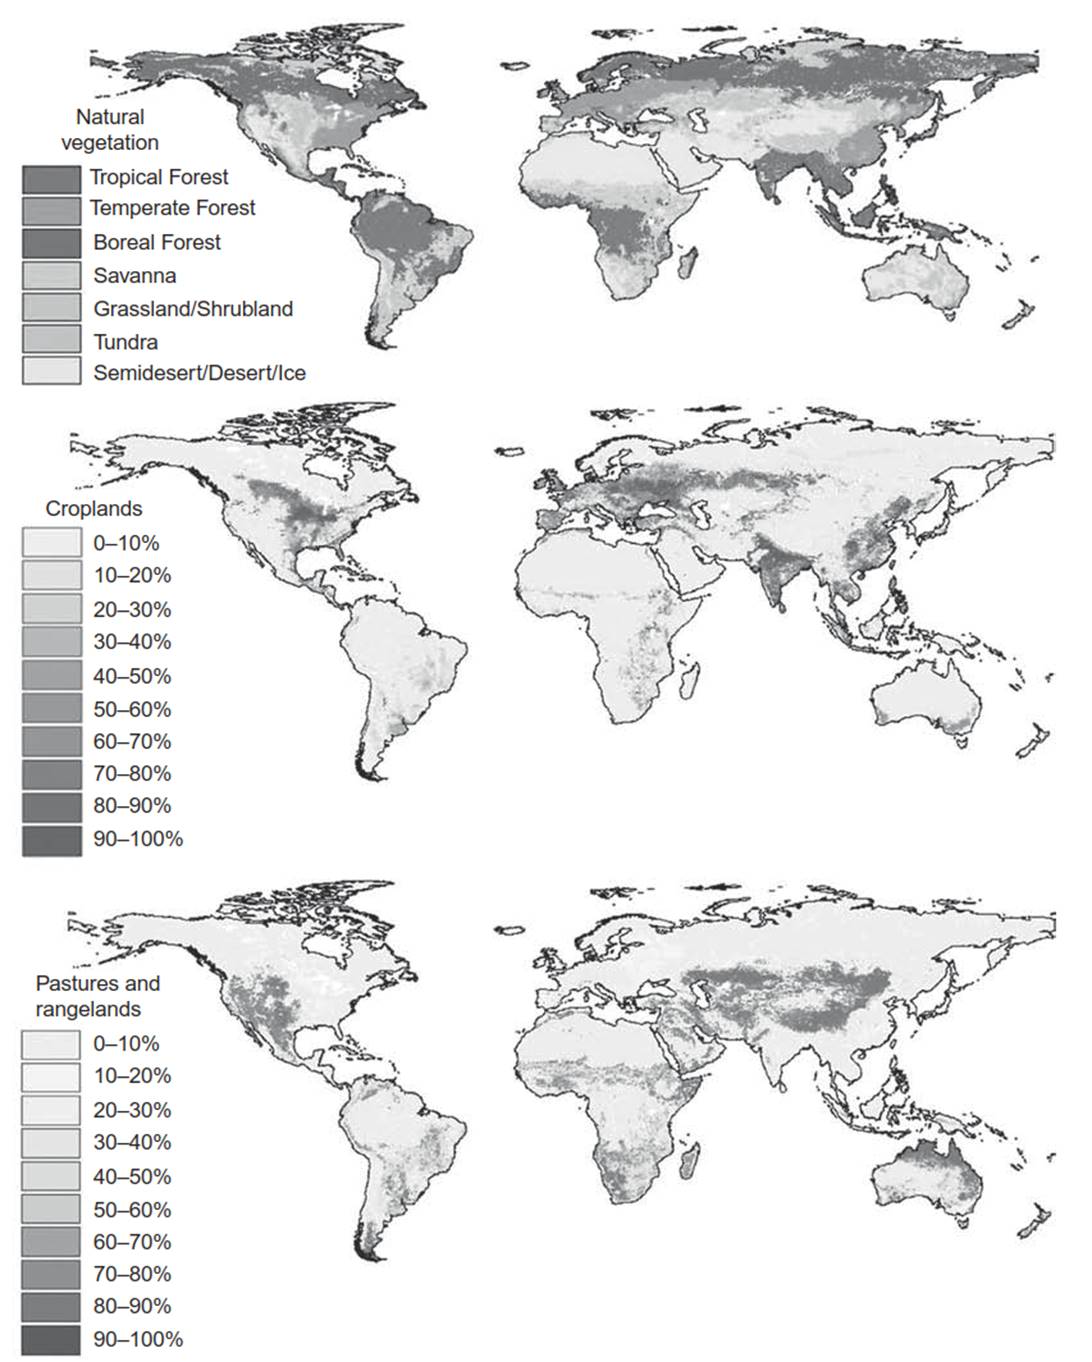
Fig. 2.8. Natural vegetation prior to human land use (top) and the extent of agricultural land during the 1990s. The panels for croplands (middle) and pastures (bottom) show the percentage of the land surface occupied by these land cover types. Reproduced from foley et al. (2005). See color plate section
Croplands cover significant portions of central North America, Europe, and Asia. Pastures and rangelands are extensive throughout the western United States, central Asia, and the tropics. Regionally, large tracts of land have been urbanized, as seen in the nighttime lights of the world (Figure 2.9). It is estimated that about 84.0 km2 of land in the conterminous United States (an area approximately equal to the state of South Carolina) is covered by buildings, roofs, roads, parking lots, and other impervious surfaces (Elvidge et al. 2007); globally, impervious surfaces cover an area of about 580,000 km2 (larger than France). Other data analysis suggests that the area of cities worldwide may be 660.0 km2 (Schneider et al. 2009).
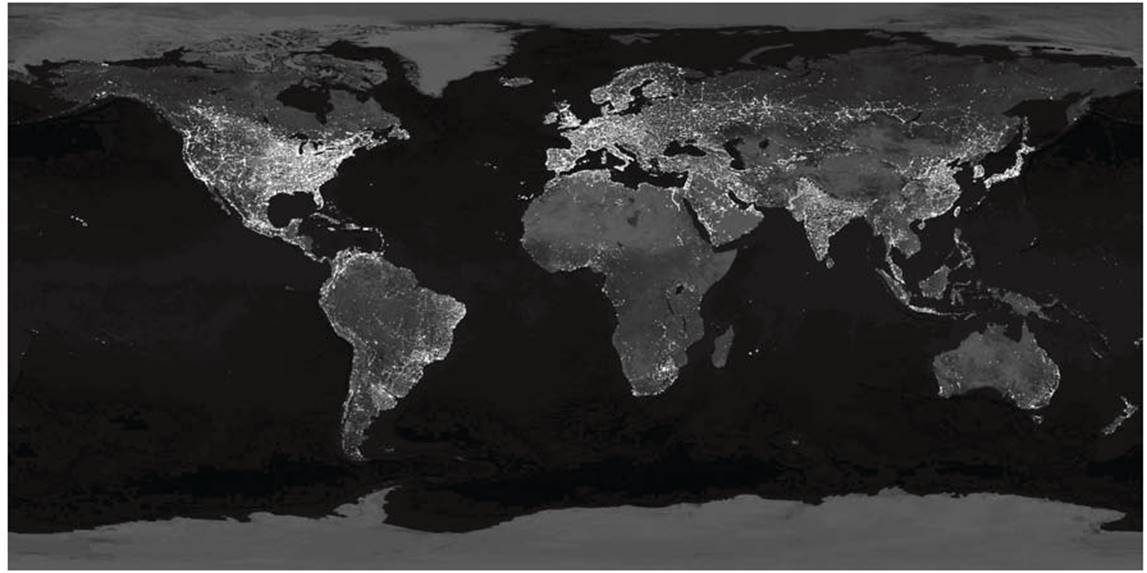
Fig. 2.9. Urban areas as seen by satellite in nighttime lights of the world. Image from the Defense meteorological Satellite program and provided by the national Geophysical Data Center (national oceanic and Atmospheric Administration, Boulder, Colorado) and Goddard Space flight Center (national Aeronautics and Space Administration, Greenbelt, maryland) courtesy of marc Imhoff (GSfC) and Christopher Elvidge (NGDC). The nighttime lights dataset provides a means to monitor urban land cover (Elvidge et al. 1997; Imhoff et al. 1997; Gallo et al. 2004; Small et al. 2005)
Anthropogenic land-cover change and human uses of land alter ecosystem functions. About 20-30 percent of the net primary production of the world’s terrestrial ecosystems is managed by humans (Vitousek et al. 1986; Rojstaczer et al. 2001; Imhoff et al. 2004), and the amount has increased over time (Krausmann et al. 2013). The clearing of forests for agricultural land releases much of the carbon stored in trees and soils to the atmosphere. It is estimated that from 1750 to 2011 an amount of carbon equal to one-half that emitted during the combustion of fossil fuels over the same period was released to the atmosphere as a result of changes in land use (Ciais et al. 2013). Vast sums of available renewable freshwater are withdrawn annually for agricultural, industrial, and municipal uses (Postel et al. 1996; Oki and Kanae 2006).
The production of nitrogen fertilizers, the cultivation of legumes and other nitrogen-fixing crops, and to a lesser extent the combustion of fossil fuels have increased the amount of reactive nitrogen in the Earth system (Galloway et al. 2003, 2004, 2008; Gruber and Galloway 2008; Erisman et al. 2011). The Haber-Bosch process to produce ammonia (NH3) from N2 for fertilizers and other uses is the single largest source of reactive nitrogen (Figure 2.10). In the late-twentieth century, human production of reactive nitrogen became larger than natural inputs. The Haber-Bosch process produces over 100 Tg N yr-1 (1 Tg = 1012 g). Cultivation of crops adds additional nitrogen, and fossil fuel combustion adds still more nitrogen. Food production accounts for three-quarter of the reactive nitrogen created by humans. The increased availability of nitrogen contributes to poor air quality and anthropogenic climate change.
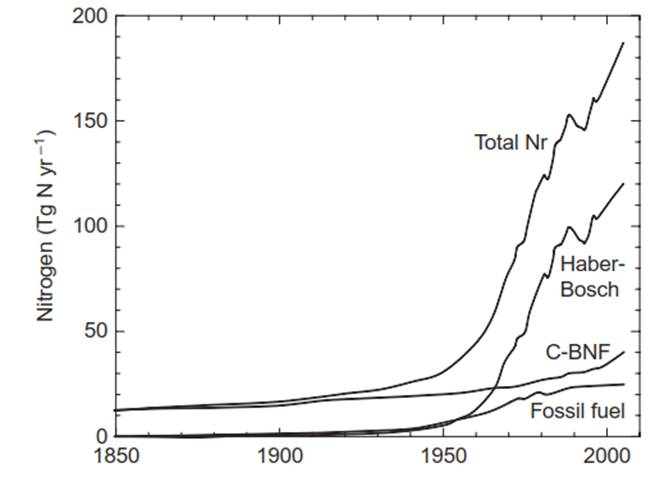
Fig. 2.10. reactive nitrogen (Nr) creation from fossil fuel combustion, cultivation of biological nitrogen-fixing crops, and the haber–Bosch process. Adapted from Galloway et al. (2003)
Human activities will continue to evolve in the future. Representative concentration pathways (RCPs) are a comprehensive set of four concentration and emission scenarios developed for use as input to models to assess anthropogenic climate change over the twenty-first century (Moss et al. 2010; van Vuuren et al. 2011a). They depict plausible scenarios of how the future may look with respect to population growth, socioeconomic change, technological change, energy consumption, and land use; resulting emissions of greenhouse gases, reactive gases, and aerosol precursors; and the concentration of atmosphere constituents (Table 2.3).
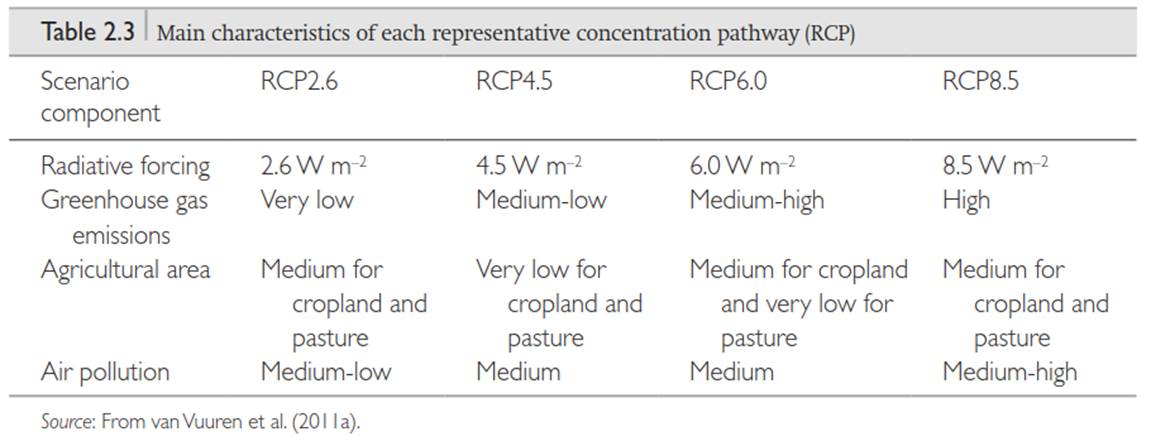
The four RCPs span a range of radiative forcing values at year 2100 from high to low. (Radiative forcing is the change in the balance between incoming and outgoing radiation at the tropopause due to a change in atmospheric constituents, such as CO2.) The various radiative forcing pathways are achieved through a range of socioeconomic and technological development scenarios. The RCPs represent a high emission scenario (8.5 W m-2, RCP8.5), two medium stabilization scenarios (6.0 W m-2, RCP6.0; 4.5 W m-2, RCP4.5), and one mitigation scenario leading to low radiative forcing (2.6 W m-2, RCP2.6).
RCP8.5 is a baseline scenario in the absence of climate change policy (Riahi et al. 2011). Increasing greenhouse gas emissions and high greenhouse gas concentrations characterize RCP8.5 (Figure 2.11). Radiative forcing increases to 8.5 W m-2 by 2100, with atmospheric CO2 increasing to 936 ppm, CH4 to 3751 ppb, and N2O to 435 ppb. It describes high fossil fuel energy consumption as a result of a large increase in the global population, slow income growth, and modest technological change and energy efficiency improvements in the absence of climate change policies. Global population increases to over 10 billion people in 2050 and to 12 billion people by 2100. Global cropland area increases, primarily in Africa and South America, to meet the growing food demand. Increasing use of fertilizers and intensification of agricultural production give rise to high N2O emissions. More livestock and rice production result in high CH4 emissions. Global forestland decreases, but bioenergy use increases, primarily as a result of wood harvest, giving rise to secondary managed forests. Although RCP8.5 depicts an absence of climate mitigation policies, air quality policies greatly affect the depiction of pollutant emissions. Emissions of sulfur dioxide (SO2), nitrogen oxides (NOx), black carbon aerosols, and organic carbon aerosols decline due to clean air legislation and technology improvements.

Fig. 2.11. Anthropogenic emissions of (a) fossil fuel CO2, (c) CH4, and (e) N2O for the four RCPs. Also shown are the atmospheric concentrations of (b) CO2, (d) CH4, and (f) N2O. Data from prather et al. (2013)
RCP6.0 is a climate policy intervention scenario (Masui et al. 2011). Total radiative forcing stabilizes at 6.0 W m-2 after 2100, with atmospheric CO2 increasing to 670 ppm, CH4 decreasing somewhat, and N2O increasing to 406 ppb (Figure 2.11). Population increases to about 10 billion at 2100, and stabilization is achieved through a variety of technologies and strategies designed to reduce greenhouse gas emissions. However, the degree of greenhouse gas emission mitigation is small compared with RCP4.5 and RCP2.6. Global cropland area increases to feed the growing population while forest area remains relatively constant.
RCP4.5 is another intervention scenario in which total radiative forcing stabilizes at 4.5 W m-2 after 2100 (Thomson et al. 2011). Atmospheric CO2 increases to 538 ppm, CH4 decreases, and N2O increases to 372 ppb (Figure 2.11). Global population peaks at 9 billion before declining. The necessary reduction in emissions is achieved through imposition of climate policies that drive declines in overall energy use and fossil fuel CO2 emissions with substantial increases in renewable energy and carbon capture systems. Global forest cover increases for carbon storage as part of the overall emissions mitigation strategy. RCP4.5 is the only scenario in which cropland area declines, because of reforestation policies and assumed increases in crop yield.
RCP2.6 is a scenario that leads to very low greenhouse gas concentrations (van Vuuren et al. 2011b). Radiative forcing peaks at ~3 W m-2 before 2100 and declines to 2.6 W m-2 by 2100 (CO2, 421 ppm; CH4, ~30% lower than 2000; N2O, 344 ppb). Greenhouse gas emissions decrease substantially over time in order to reach this low radiative forcing (Figure 2.11), necessitating substantial changes in energy use. The mitigation strategies utilize bioenergy, with consequences for global land use. RCP2.6 has the largest increase in global cropland area.

Fig. 2.12. Climate forcings and simulated temperature change in an Earth system model. (a) Atmospheric Co2 concentration. (b) Annual nitrogen deposition on land. (c) Cropland area. (d) forest area. (e) Annual wood harvest area. (f) Change in land temperature (relative to 1986–2005). Data from Lawrence et al. (2012)
Figure 2.12 illustrates some of these historical and future forcings used to simulate climate for the twentieth and twenty-first centuries. RCP8.5 has the largest warming, followed by RCP6.0 and RCP4.5; RCP2.6 has the smallest warming. A particularly important difference among these is the depiction of future land use (Hurtt et al. 2011).
References:
Andres, R. J., Boden, T. A., and Breon, F.-M., et al. (2012). A synthesis of carbon dioxide emissions from fossil-fuel combustion. Biogeosciences, 9, 1845-1871.
Bindoff, N. L., Stott, P. A., AchutaRao, K. M., et al. (2013). Detection and attribution of climate change: from global to regional. In Climate Change 2013: The Physical Science Basis. Contribution of Working Group I to the Fifth Assessment Report of the Intergovernmental Panel on Climate Change, ed. T. F. Stocker, D. Qin, G.- K. Plattner, et al. Cambridge: Cambridge University Press, pp. 867-952.
Boucher, O., Randall, D., Artaxo, P., et al. (2013). Clouds and aerosols. In Climate Change 2013: The Physical Science Basis. Contribution of Working Group I to the Fifth Assessment Report of the Intergovernmental Panel on Climate Change, ed. T. F. Stocker, D. Qin, G.- K. Plattner, et al. Cambridge: Cambridge University Press, pp. 571-657.
Ciais, P., Sabine, C., Bala, G., et al. (2013). Carbon and other biogeochemical cycles. In Climate Change 2013: The Physical Science Basis. Contribution of Working Group I to the Fifth Assessment Report of the Intergovernmental Panel on Climate Change, ed. T. F. Stocker, D. Qin, G.-K. Plattner, et al. Cambridge: Cambridge University Press, pp. 465-570.
Elvidge, C. D., Baugh, K. E., Hobson, V. R., et al. (1997). Satellite inventory of human settlements using nocturnal radiation emissions: A contribution for the global tool chest. Global Change Biology, 3, 387-395.
Date added: 2025-05-15; views: 519;