Rates of Natural Increase. Population Pyramids
The rate of natural increase is the percentage by which a population grows in a year. It is computed by subtracting the crude death rate from the crude birth rate. Following our example, a country with a birth rate of 18 per 1,000 and a death rate of 14 per 1,000 will have a rate of natural increase of 4 per 1,000, or 0.4 percent.
Rates of natural increase (Figure 3-4c) are inversely related to levels of economic development. High rates of natural increase are found in much of Africa, Asia, and Latin America, while low rates of natural increase are found in Europe, Australia, and Anglo-America. Indeed, a few European countries have recently experienced negative rates of natural increase.
Where rates of natural increase are high, large proportions of the population consist of children. In some countries, as much as half of the population is under the age of fifteen. Along with the elderly, they must be cared for by those in the prime working-age categories. In addition, an increasing proportion of children in a given population implies that more people will soon be entering the childbearing years. Even a sudden decline in the birth rate will fail to stabilize the population for several decades.
The dependency ratio is the ratio of children and elderly people to the working population. Usually, we define the working population as those aged between fifteen and sixty-five. Hence the dependency ratio is the ratio of those under fifteen and those over sixty-five to the rest of the population. In much of Asia and Africa, dependency ratios are high, because such a large proportion of the population consists of children. Migration of young adults to distant cities or countries in search of better employment opportunities compounds the problem of high dependency ratios in these places.
Population Pyramids. Age-specific birth and death rates are useful indicators of the age distribution of a population. Where birth rates are consistently higher than death rates, the population consists of a high proportion of young people. Where birth and death rates are comparable, there are fewer young people, and the average age of a population is higher.
Population pyramids are graphic models that are useful in illustrating the relationships between birth rates, death rates, and the age structures of populations. In order to construct a population pyramid, data dividing the population of a place into age and gender categories are needed. Age-related data are grouped by age intervals, or cohorts. For example, people aged ten to fourteen years may make up a cohort. Data grouped by cohort are used to construct a graph depicting the number or percentage of males and females within each cohort.
The demographic structure of a place can be inferred from the shape of its population pyramid. Wide-based population pyramids represent places with expanding populations, implying that crude birth rates consistently exceed crude death rates. The population pyramid for Peru (Figure 3-5) is typical of a population pyramid representing any less developed countries.
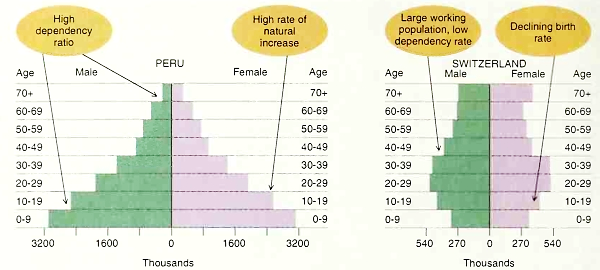
Figure 3—5. Population Pyramids. Population pyramids from representative countries in the developed and less developed world illustrate the dramatic differences in the age structure of their respective populations. Wide-based population pyramids typify less developed countries that remain at the early stage of the demographic transition
By contrast, population pyramids for places with stable populations are more uniform, with proportions in each age cohort roughly equal. The population pyramid for Switzerland is typical, and straight-sided population pyramids are associated with countries with relatively high dependency ratios. Population pyramids are useful in many facets of geographical research.
Date added: 2023-01-14; views: 832;