Three-Cell Atmospheric Circulation: Hadley, Ferrel Dynamics & Global Climate Zones
Figure 5.4 illustrates the general circulation of the atmosphere as a system of high and low surface pressure regions arising from the unequal heating of the surface. In contrast to the single cell model, each hemisphere has three cells that redistribute heat. In the Northern Hemisphere, warm tropical air with high pressure aloft flows as upper-level wind from the equator towards the North Pole. As it moves north, the Coriolis force deflects the wind to the east. This poleward moving air cools as it moves northwards. The column shrinks, the air becomes denser, and surface pressure increases.
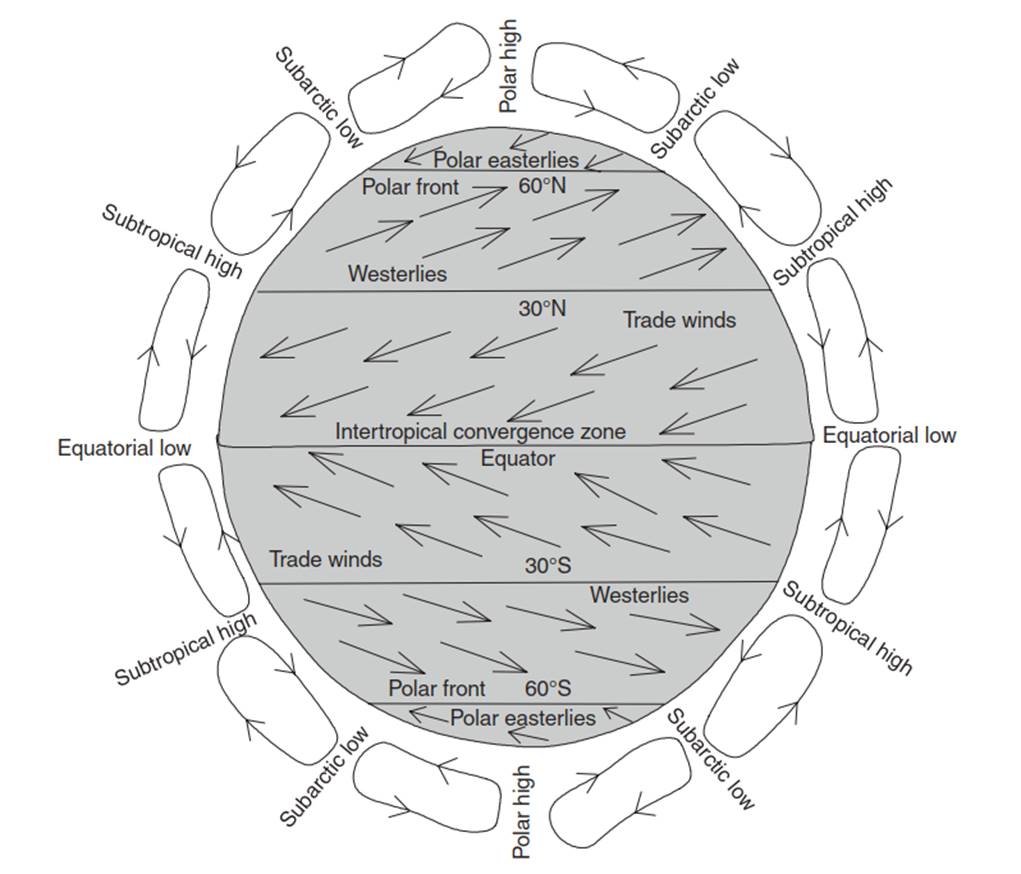
Fig. 5.4. Idealized atmospheric circulation with resulting surface winds and surface pressure
The converging masses of air moving from the tropics to middle latitudes further increases surface pressure. This produces a belt of high surface pressure at about latitude 30° N. Air flows along the surface back towards the equator from this high pressure, being deflected to the west by the Coriolis force. These are the northeasterly trade winds. This tropical cell is known as the Hadley circulation. At the North Pole, cold air causes low pressure aloft while warmer air at latitude 60° N creates high pressure aloft.
This warm air flows towards the pole as southwesterly wind aloft (northward moving air deflected to the east by the Coriolis force) and back as the polar easterlies along the surface (southward moving air deflected to the west by the Coriolis force). A third cell in the middle latitudes between latitudes 30° N and 60° N, known as the Ferrel cell, circulates in a direction opposite to the Hadley cell and connects the tropical and polar cells. The surface high pressure at latitude 30° N creates subsiding motion and surface divergence. One branch of this air spreads southwards as trade winds. The other branch flows northwards, being deflected to the east in middle latitudes. These are the mid-latitude westerlies. Similar circulations develop in the Southern Hemisphere.
Figure 5.4 shows several prominent features characterize the circulation of the atmosphere. Semi-permanent low surface pressure systems develop at the equator and latitude 60°, where air rises. Semi-permanent high surface pressure systems develop at the poles and the subtropics at latitude 30°, where air subsides. Between latitudes 30° N and 30° S, surface trade winds converge along the equator from the northeast in the Northern Hemisphere and the southeast in the Southern Hemisphere in a broad region known as the intertropical convergence zone. Between latitudes 30° and 60° in both hemispheres, surface winds are westerly. At about latitude 60°, these winds clash with polar easterlies along the polar front.
Figure 5.5 shows the actual geographic distribution of surface pressure and surface wind for January and July. The three principal features are: high pressure cells at about 30° latitude in both hemispheres; low pressure along the equator between these subtropical high pressure centers; and low pressure at high latitudes. Wind flows clockwise around high pressure systems in the Northern Hemisphere. Thus, in the Northern Hemisphere the northern edges of the subtropical high pressures drive the mid-latitude westerlies while the southern edges drive the westwardly flowing trade winds. Conversely, winds flow counterclockwise around low pressure centers, driving the polar easterlies to the north and the mid-latitude westerlies to the south. In the Southern Hemisphere, flows are in the opposite direction (counterclockwise around high pressures and clockwise around lows).
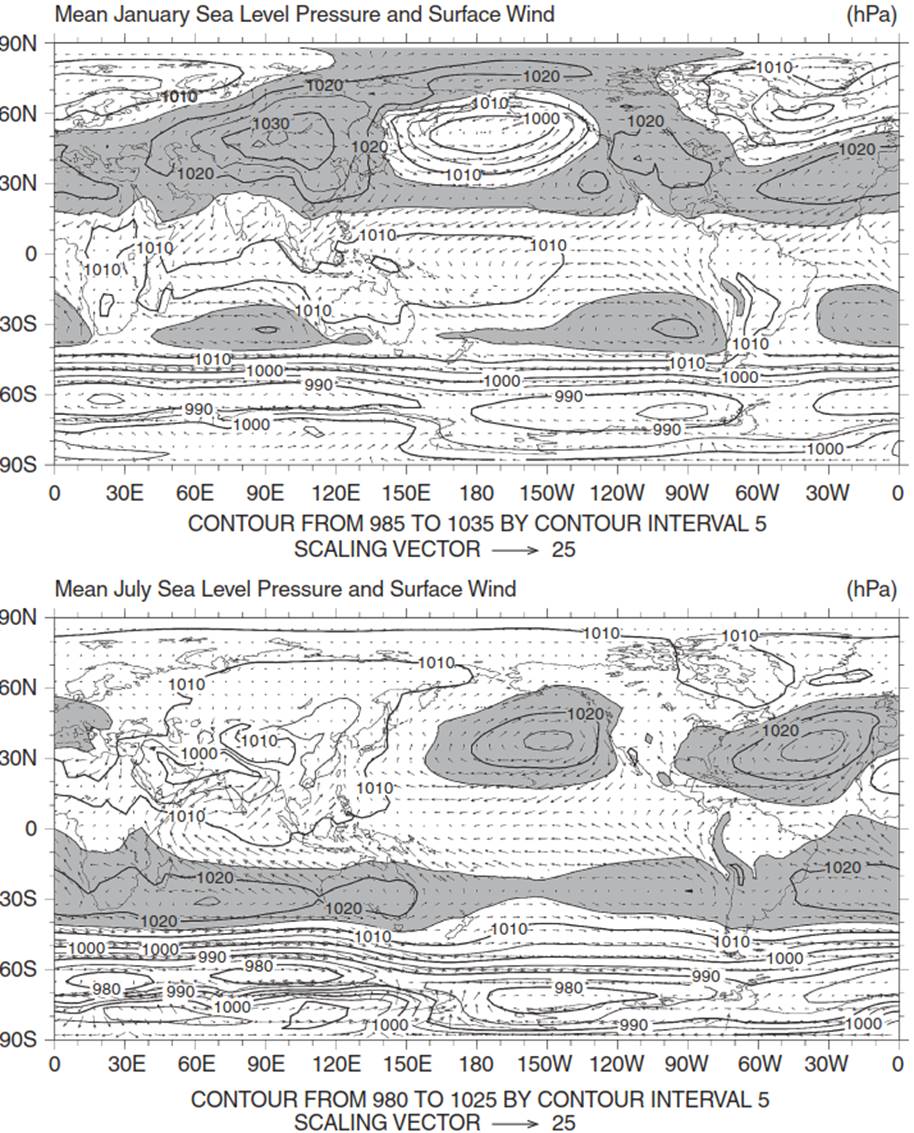
Fig. 5.5. Mean sea level pressure for (a) January and (b) July, with units hectopascals (hPa). High pressure regions greater than 1015 hPa are shaded. Low pressure regions less than 1015 hPa are unshaded. Arrows indicate the direction and magnitude of surface wind in meters per second. Data provided by the national Center for Atmospheric research (Boulder, Colorado)
The general circulation of the atmosphere accounts for the major climate zones in the world. Temperatures are generally distributed in latitudinal bands with warmest temperatures in the tropics and progressively colder temperatures towards the poles (Figure 5.6). Rainfall is abundant where air rises, such as along the equator, and low where air sinks, such as near latitudes 30° N and 30° S (Figure 5.7) . In the tropics, the trade winds converge in the intertropical convergence zone.
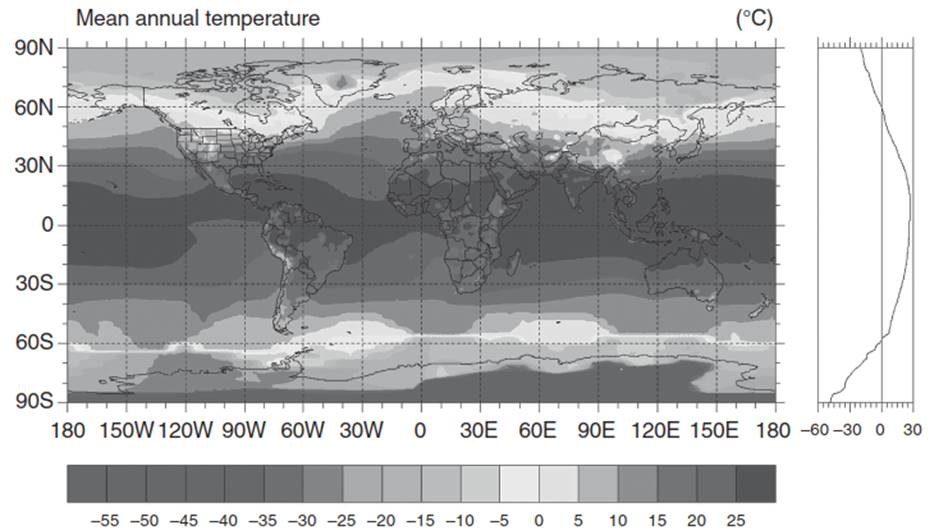
Fig. 5.6. Annual mean air temperature. The chart on the right-hand side shows temperature averaged around the world, from longitude 180° W to 180° e, as a function of latitude. Data provided by the national Center for Atmospheric research (Boulder, Colorado). See color plate section
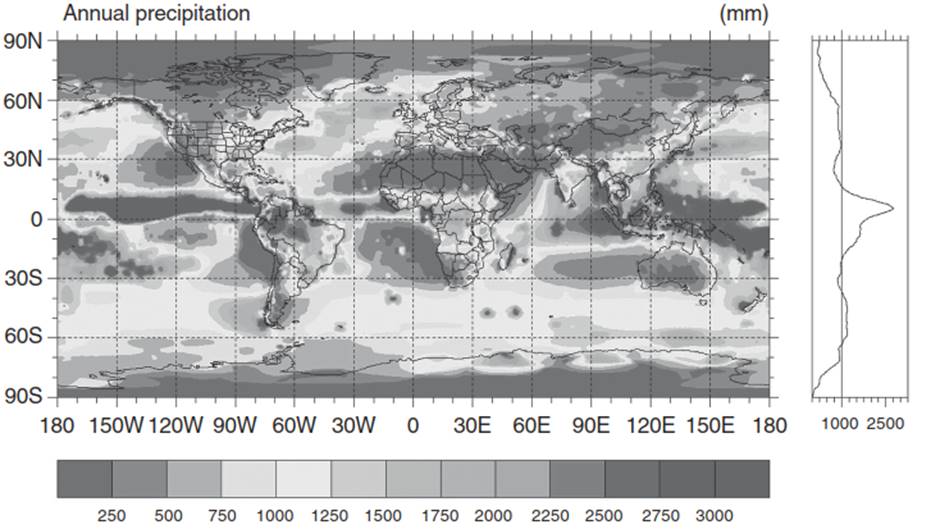
Fig. 5.7. Annual mean precipitation. The chart on the right-hand side shows precipitation averaged around the world, from longitude 180° W to 180° e, as a function of latitude. Data provided by the national Center for Atmospheric research (Boulder, Colorado). See color plate section
This convergence and lifting of warm, moist air leads to high annual rainfall. Many tropical regions have wet and dry seasons. This occurs because of seasonal variation in the geographic location of the convergence zone. Regions of subsidence, as occurs in high pressure systems, generally have low rainfall. Many of the world’s major deserts - in southwestern United States, North Africa, southern South America, South Africa, and western Australia - occur on the eastern flanks of the subtropical high pressures near latitudes 30° N and 30° S. Rainfall is also high, though not as high as in the tropics, in the middle latitudes between 40° and 60° where warm moist air clashes with cold air along the polar front.
Date added: 2025-05-15; views: 1073;