
Predicting Tides and Tidal Currents: Bores and Harmonic Analysis
Tidal Bores and Rapid Water Level Changes. In some areas of the world, large-amplitude tides cause large and rapid changes in water volume along shallow bays or river mouths. Under these conditions, the rising tide is forced to move toward the land at a speed greater than that of the shallow-water wave, whose speed is determined by the depth of the water or the speed of the opposing river flow. When the forced tide wave breaks, it forms a spilling wave front that moves into the shallow water or up into the river. This wave front appears as a wall of turbulent water called a tidal bore and produces an abrupt change in water levels as it passes.
A single bore may be formed, or a series of bores may be produced. The bores are usually less than a meter in height but can be as much as 8 m (26 ft) high, as in the case of spring tides on the Qiantang River of China. The Amazon, Trent, and Seine rivers have bores. Fast-rising tides also send bores across the sand flats surrounding Mont-Saint-Michel in France and into Turnagain Arm of Cook's Inlet in Alaska. The bore in the Bay of Fundy in Canada (fig. 10.16) has been reduced by the construction of a causeway. Towns in areas having tidal bores often post warnings; their turbulence can be a severe hazard because they suddenly flood areas that were open stretches of beach only minutes before.
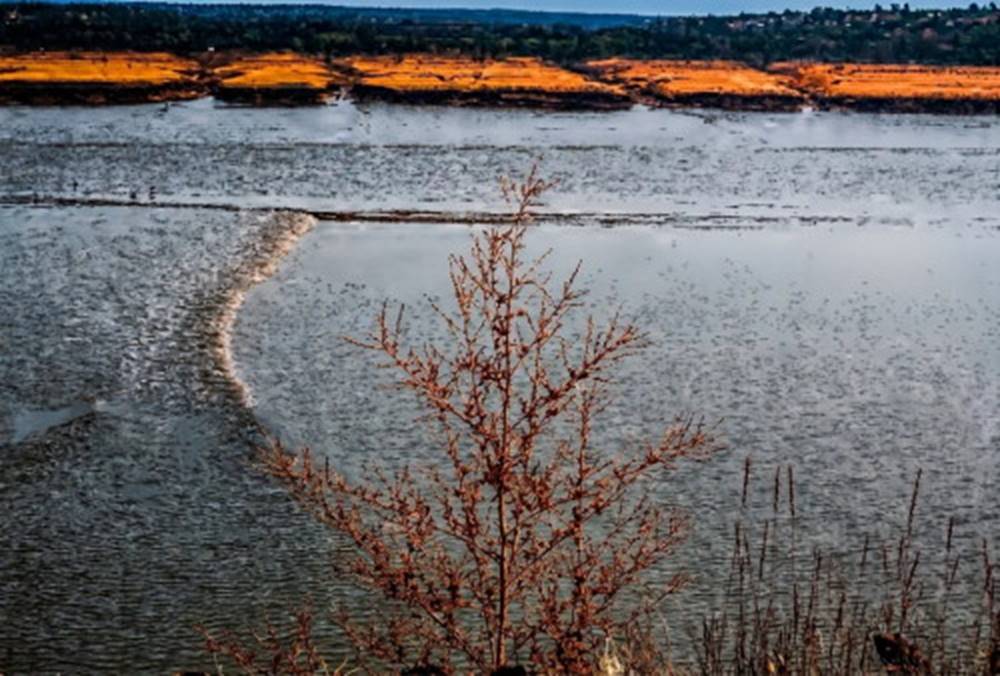
Fig. 10.16. The fast-rising tide in the Bay of Fundy produces a tidal bore that sweeps across the shallows.
Prediction Methodology and Harmonic Analysis. Because of all the natural combinations of progressive and standing tides and the factors that affect them, it is not possible to predict the Earth's tides from knowledge of the tide-raising bodies alone; equilibrium tidal theory is not adequate for the task. Accurate, dependable daily tidal predictions are made by combining actual local measurements with astronomical data. The rise and fall of the tides are measured over a period of years at selected locations. Primary tide stations make these water-level measurements for at least 19 years, to allow for the 18.6-year declinational period of the Moon. From these data, mean tide levels are calculated.
Oceanographers use a technique called harmonic analysis to separate the tide record into components with magnitudes and periods that match the tide-raising forces of the Sun and the Moon. They are then able to isolate the effect of the local geography, known as the local effect. Tides for any location are predicted by combining the local effect with the predicted astronomical data. Complex and cumbersome mechanical computers or tide machines were once used to predict the tides, but today computers quickly and easily recombine the data and predict the time, date, and elevation of each high-water and low-water level.
Tide and Tidal Current Tables. Tide and tidal current tables for North America were published by the National Ocean Survey (NOS) of the National Oceanic and Atmospheric Administration (NOAA) until 1996. These tables are now available on the Internet and published by private companies using NOAA data. Tide tables give the dates, times, and water levels for high and low water at primary tide stations (see table 10.2). There are 196 primary tide stations in the United States, but many more locations require accurate tide predictions. The data for these auxiliary stations are determined by correcting nearby primary station data for time and tide height.
Tidal currents in the open ocean have been explained as rotary currents formed by the passing tide wave form and the deflection of water particles due to the Coriolis effect. Tidal currents in the deep sea are of scientific interest to oceanographers concerned with removing this circular motion from their data to obtain the net flows of the major ocean currents. Tidal currents in harbors and coastal waters are of major interest to commercial vessels and pleasure boaters, because these currents can be very strong and must be taken into account by anyone who wants to navigate in such waters.
Like the tides, the tidal currents are first measured at selected primary locations in important inland waterways and channels. These current data are studied to determine how the speed and direction of the tidal current are related to the predicted tide-level changes. As before, the local effect is determined and is used to predict tidal currents on the basis of the tide tables.
Once tidal currents have been predicted for a location, they can be graphed with time and compared with the tidal height curves for that area. If maximum current times coincide with the times for either low or high water, the tide has a progressive wave form. If maximum current times coincide with mid-tide stages, the tide is a standing wave type tide.
Tidal current data (see table 10.3) are published in a format similar to that of the tide tables. The times of slack water, maximum flood currents, and maximum ebb currents, as well as the speed of the currents in knots, and the direction of flow for ebb and flood currents are given for primary channel stations. Auxiliary tidal current stations are keyed to the primary current stations with correction factors to determine current speed, time, and direction at the secondary stations. This information allows the master of a vessel to decide at what time to arrive at a particular channel in order to find the current flowing in the right direction or how long to wait for slack water before choosing to proceed through a particularly swift and turbulent passage.
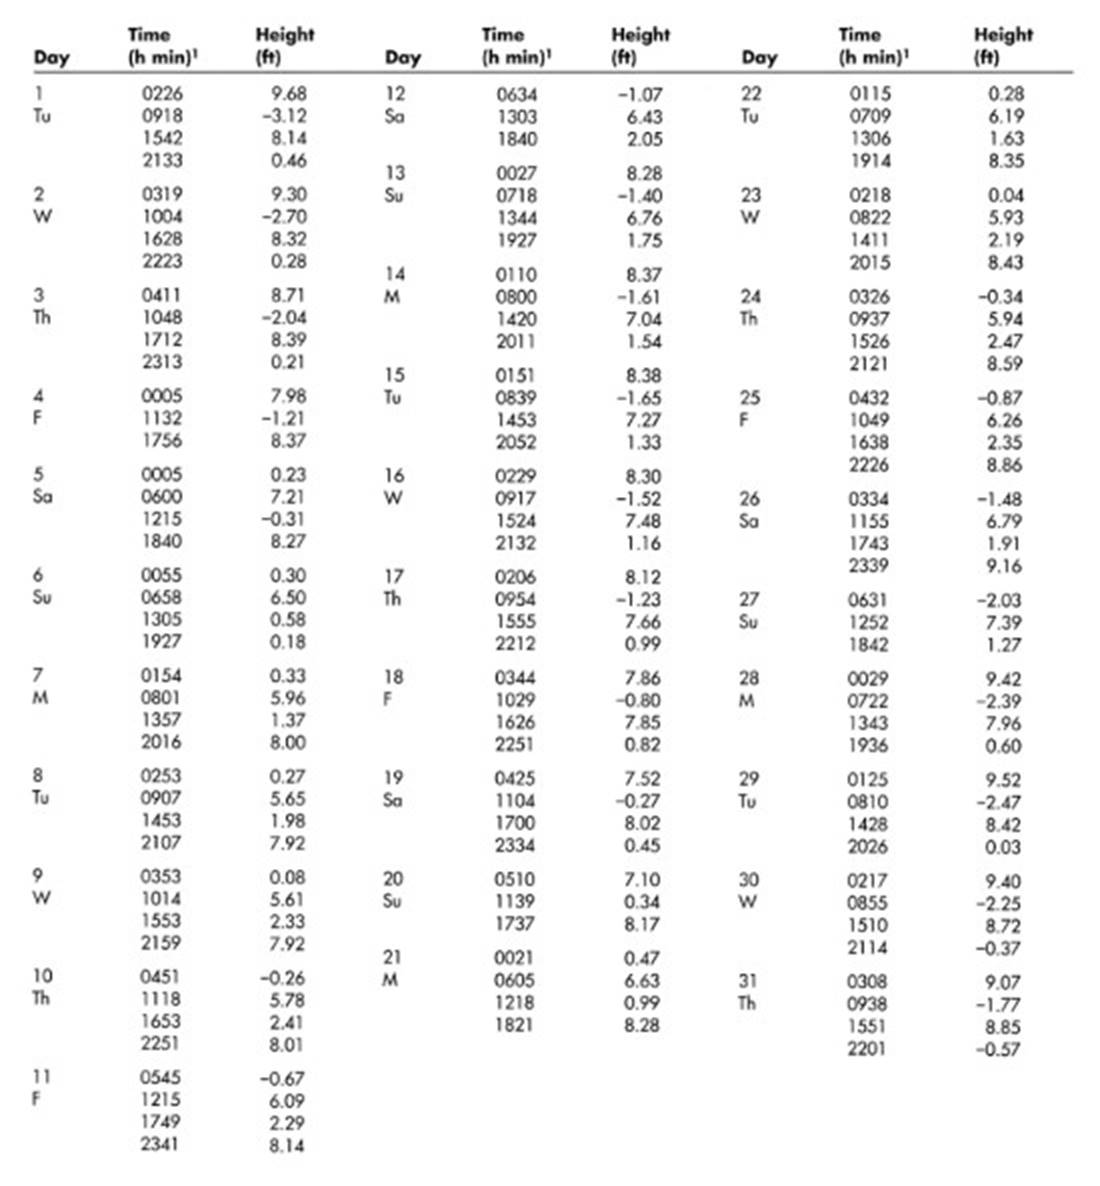
Table 10.2. Times and Heights of High and Low Waters for August 2000, Aberdeen, Washington, United States.Data from WWW Tide Predictor, ¹hours, minutes. Time meridian 120°W. 0000 is midnight; 1200 is noon, Pacific Daylight Time. Heights are referred to mean lower low water, which is the chart datum of soundings.
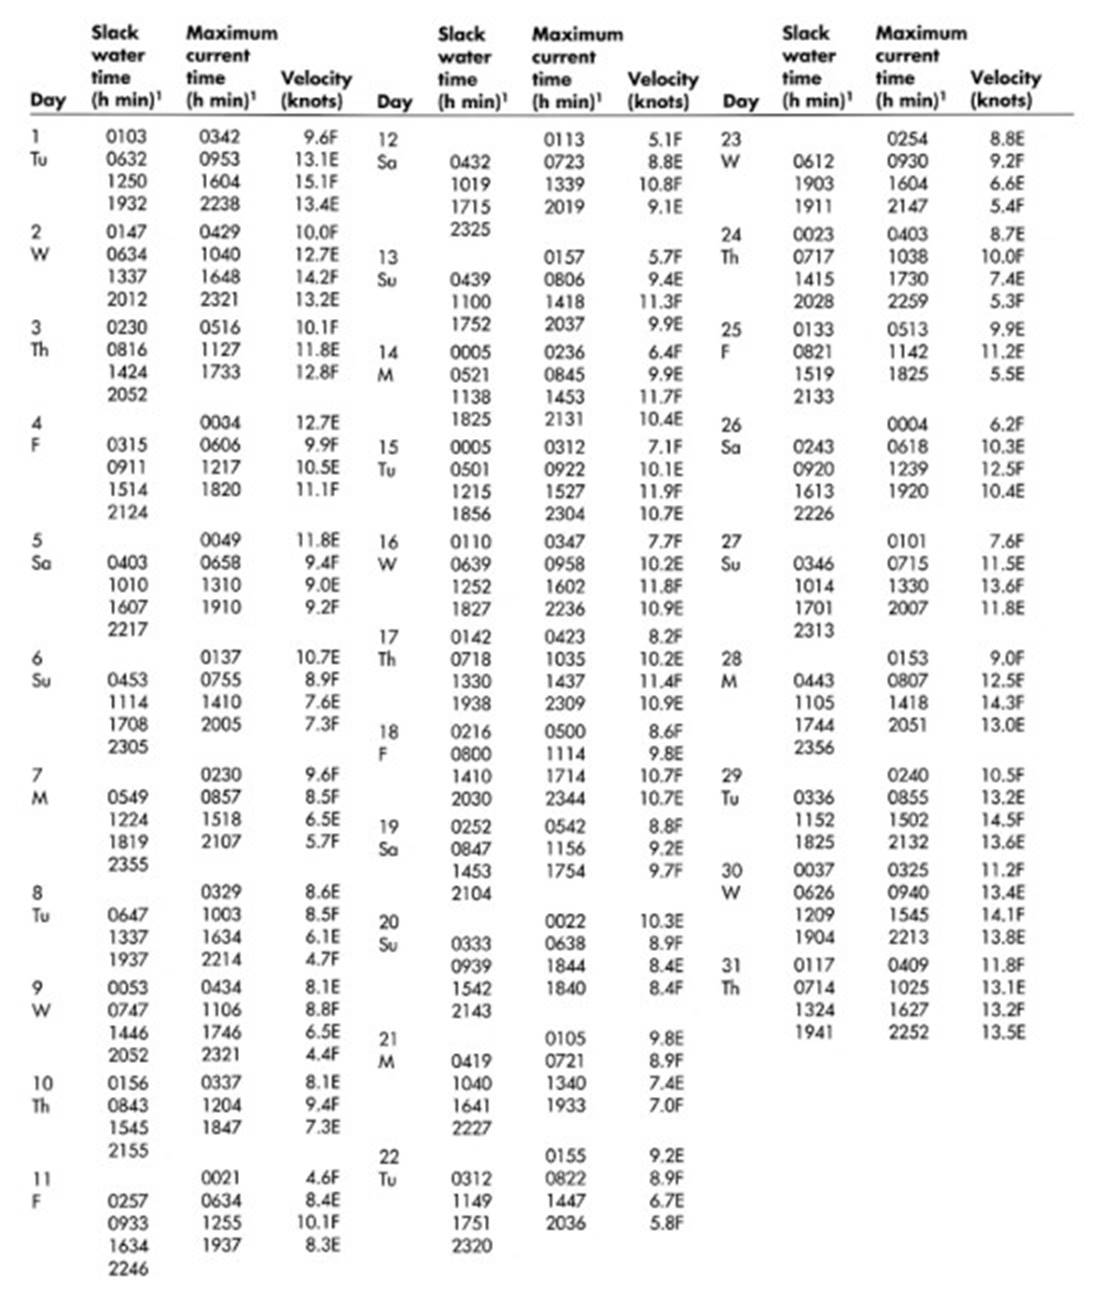
Table 10.3. Tidal Currents for August 2000, Seymour Narrows, British Columbia, Canada. Data from WWW Tide Predictor, ¹hours, minutes. Time meridian 120°W. 0000 is midnight; 1200 is noon; Pacific Daylight Time. F, flood dir. 180° true. E, ebb dir. 000° true.
Date added: 2026-11-09; views: 8;