How Plant-Herbivore Interactions Drive Genetic Diversity
The interaction of plants with the plethora of herbivorous animals surrounding them is generally regarded as a major driver of biodiversity. This has in a few cases been possible to demonstrate experimentally. In field experiments with a native plant, Oenothera biennis, it was shown that the suppression of insect herbivores in one half of the plants by insecticide treatment not only suppressed herbivore-inflicted damage but also resulted in rapid evolutionary change, apparent as genetic differentiation between the populations. Over five growing seasons, herbivore defence declined in the protected populations, for instance, because of lower elagitannin levels in fruits (Agrawal et al. 2012). Conversely, competitive ability increased. Such experiments document evolutionary consequences of a tradeoff between defence and growth in real time.
Furthermore, plant-herbivore interactions are seen as a major reason for the rich diversity of plant secondary metabolism. As discussed, plant families or plant species synthesise a characteristic cocktail of secondary metabolites. Importantly, also, the spectrum of secondary metabolites produced by an individual plant is strongly influenced by its genotype—that is, the combination of allelic variants of genes encoding regulatory proteins, enzymes or other proteins controlling the spectrum and synthesis rate of secondary metabolites.
The molecular dissection of chemical herbivore defence mechanisms provided the first detailed insights into how synthesis and diversity of secondary metabolites arose and which evolutionary forces maintain such diversity. A comparatively well-understood system is glucosinolate biosynthesis in Brassicaceae. Accessions of A. thaliana differ in the mixture of constitutively produced glucosinolates and of glucosinolate breakdown products released when glucosinolates come into contact with myrosinases (Fig. 8.25). The diversity arose through gene duplications and the neofunctionalisation of gene copies. The blend of breakdown products has various consequences for plant-herbivore interactions. The more volatile breakdown products are more likely to attract specialist herbivores or the parasitoids and predators of herbivores.
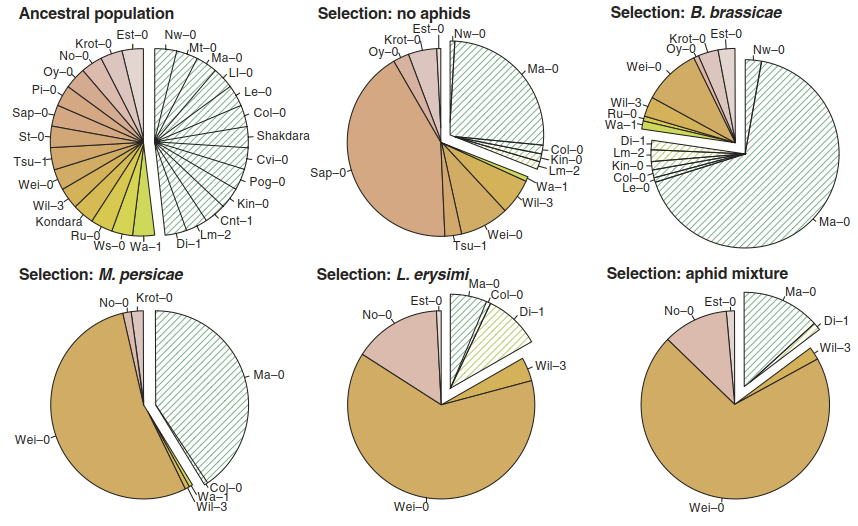
Fig. 8.31. Evolution in action: herbivores differentially select glucosinolate chemotypes. A multigeneration selection experiment was performed with an ancestral population consisting of 27 Arabidopsis thaliana accessions differing in the type of methionine-derived glucosinolates (orange: C3 chemotype, green: C4 chemotype). The populations were exposed to one aphid species (Brevicoryne brassicae, Lipaphis erysimi or Myzus persicae) or a combination of them. The pie charts illustrate the changes in the composition of A. thaliana accessions from equal proportions of 27 genotypes to treatment-specific compositions after five generations of selection. The mean genotype frequencies based on six replicate populations are shown. For example, the accession Sap-0, which produces much smaller amounts of glucosinolates than the other accessions, became dominant in the absence of herbivore pressure but was eliminated from the population in the presence of aphids. (Zust et al. 2012)
Nitriles are less toxic than isothiocyanates but, at the same time, do not carry the risk of alerting specialists to the presence of a suitable host plant, because specialists use isothiocyanates as clues. Such contrasting consequences of defence molecules maintain the diversity of genotypes, since different habitats select for different genotypes. For example, variation in the polymorphic GS-ELONG locus controlling the side chain length of methionine- derived glucosinolates in A. thaliana is explained by the distribution of two specialised aphid species feeding on A. thaliana (Zust et al. 2012). Multigeneration selection experiments with artificial populations demonstrated that the herbivore pressure exerted by the two aphid species selects distinct chemotypes—that is, it causes rapid changes in the relative abundance of the alleles controlling these chemo- types (Fig. 8.31).
Date added: 2025-02-01; views: 552;