Water Fluxes in Terrestrial Ecosystems
Water Budget at Ecosystem Scale. Water flows through ecosystems, is stored only to a small degree in the soil profile, and leaves the ecosystem, either as water or water vapour. Thus, it is more appropriate to speak of a water budget than of a water cycle at the ecosystem scale. The ecosystem gains water via precipitation (rain, snow, fog, dew, rime and hail, adding up to total precipitation). Water reaches the ground below a plant canopy as throughfall or as stemflow (Fig. 16.1). Throughfall is defined as the sum of precipitation reaching the soil, that is, precipitation that either falls through canopy gaps or is intercepted by foliage, and what is not evaporated from these surfaces drips down leaves or needles (leaf drip).
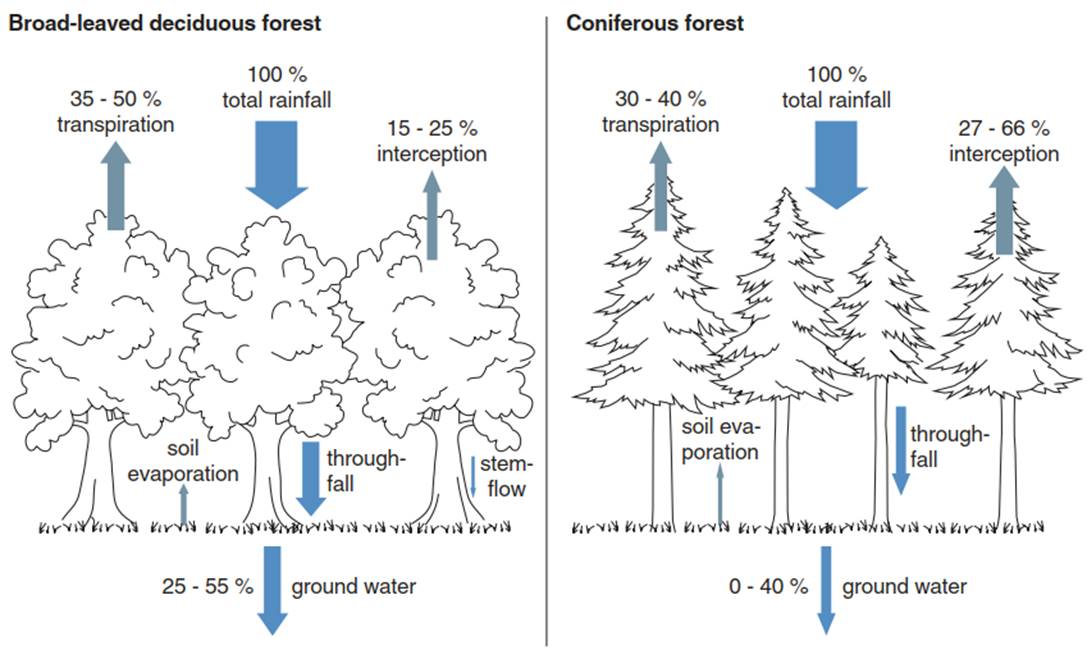
Fig. 16.1. Water fluxes in terrestrial ecosystems. Water enters the ecosystem as precipitation or as lateral water flow (not shown), is intercepted by the canopy, and reaches the ground via stemflow and throughfall. Water leaves the ecosystem via run-off (not shown), infiltrates into the soil, contributing to seepage and groundwater recharge, but also leaves as water vapour via transpiration and evaporation
Throughfall is larger in open canopies and smaller in dense canopies because foliage, branches and stems intercept precipitation water (interception), of which a fraction evaporates and never reaches the ground. Interception by deciduous forests is typically much smaller than that by coniferous and evergreen forests (15-25% vs. 27-66%, respectively) (Fig. 16.1) owing to their clumped needle arrangements and long foliage presence throughout the year. Stemflow is higher for trees with smooth barks and a funnelshaped crown architecture (such as beech, Fagus spp.) compared to trees with rough barks and irregularly shaped crowns (such as oak, Quercus spp.).
Thus, throughfall is the difference between bulk precipitation (measured above the canopy or in the open), stemflow and interception (evaporation from plant surfaces), measured by rainfall collectors placed on the ground, stratified by canopy cover (accounting for gaps as well). The structure of the vegetation may modify the water input, for example, by “stripping” water from ground-reaching clouds (i.e. fog) via increased above-ground surface area that can intercept fog droplets. Examples are the laurel forests in Tenerife, which depend to a large extent on water harvested from clouds, or the tropical montane cloud forests in Puerto Rico. In Sequoia sempervirens (coastal redwood) forests in Northern California, 34% of the annual water input is due to fog drip, contributing 19% of transpired water during summer for large trees (Dawson 1998).
Depending on how bulk precipitation is defined or where it is measured (above the canopy or in the open over low vegetation), interception can lead to water losses (relative to total precipitation measured above the canopy) or to water gains (relative to precipitation measured over low vegetation, which does not strip out fog). Moreover, ecosystems lose water by run-off and infiltration into the ground, contributing to seepage into the groundwater or river discharge, but also as water vapour lost to the atmosphere via evaporation from wet surfaces and via transpiration from plant foliage.
The hydrological balance can be described as follows:

where P denotes total precipitation, E evapotranspiration, F run-off and seepage, and ∆S change in soil water storage. Often, ∆S is considered zero and therefore omitted from this equation.
The water budget is positive if P > E + F + ∆S, for example, in areas with high rainfall. It is negative if P < E + F + ∆S, for example, when P is completely used by E or if E is fed by supplies other than P, such as irrigation. Spatially as well as temporally, the hydrological budget is highly variable, but on average, as much as 60% of total terrestrial precipitation is returned to the atmosphere by ecosystem evapotranspiration.
Understanding the partitioning of precipitation into evapotranspiration and run-off/seepage processes is one of the challenges in ecohydrology, since not only climate but also land cover (e.g. forest, grassland, cropland, urban area) and land use (e.g. crop rotation, intensive agriculture, extensive grazing), and thus terrestrial ecosystems, strongly affect this partitioning. Using the concept of Budyko (1974) (Fig. 16.2), one can separate the climatic radiative effect (driven by net radiation) from the land surface evaporative effect (driven by precipitation) and, thus, study the impacts of ecosystem characteristics.
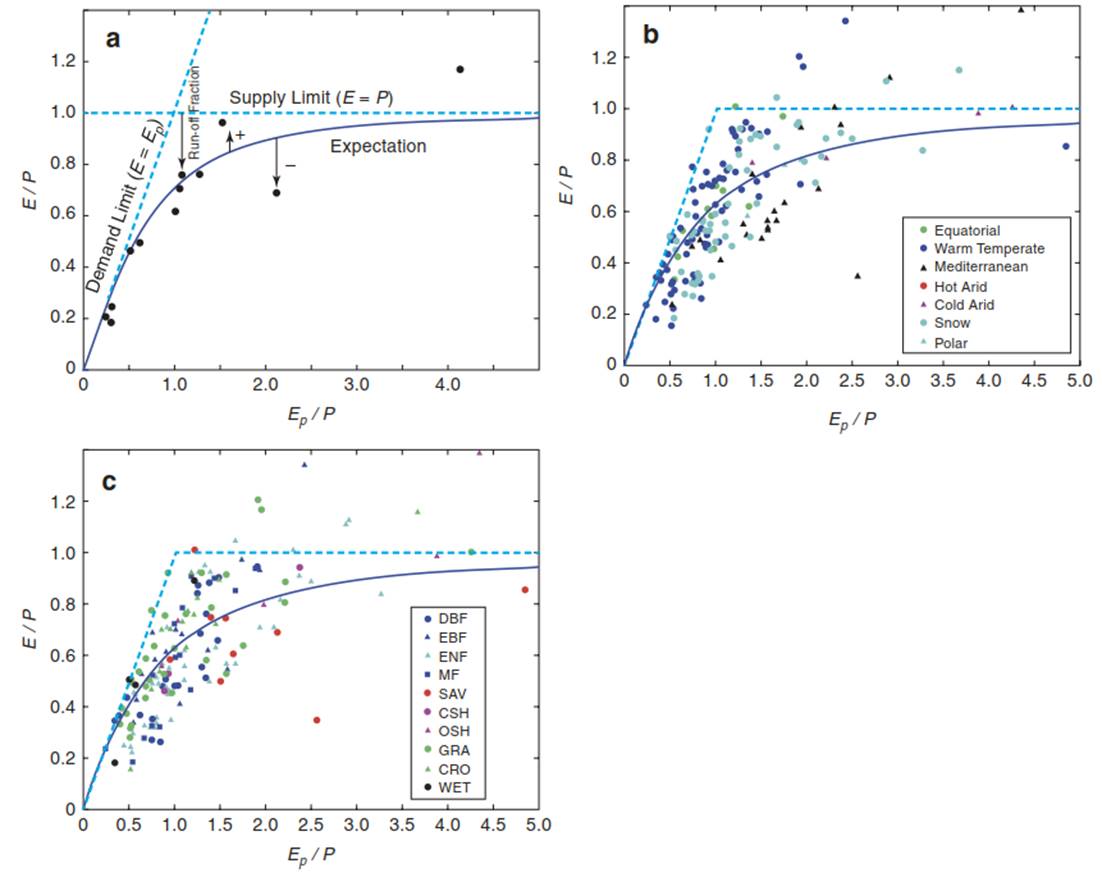
Fig. 16.2. Budyko concept. a Based on annual data for precipitation (P), potential evapotranspiration (Ep) and actual evapotranspiration (E), one can separate the radiative effect (driven by net radiation) from the evaporative effect (driven by precipitation) on ecosystem water vapour fluxes. The dashed lines represent the demand (E = Ep) and supply (E = P) limits. The black line represents expected ecosystem water vapour fluxes. The vertical arrows depict deviations from the expected value (plus or minus). The arrow from the supply limit line to the actual data point (i.e. the term 1 — E/P) shows the percentage run-off and seepage relative to precipitation for this site. b Data from 167 ecosystem sites covering different climate types and c different ecosystem types across the globe are shown. The dashed lines in b and c represent the demand and supply limits. DBF deciduous broadleaf, EBF evergreen broadleaf, ENF evergreen needleleaf, MF mixed forest, SAV savanna including woody savanna, CSH closed shrubland, OSH open shrubland, GRA grassland, CRO cropland, WET wetland. (Modified from Williams et al. (2012))
This makes it possible to compare effects for different vegetation and ecosystem types, but also to study impacts of inter- and intraseasonal variations. Plotting the ratio of mean annual (actual) evapotranspiration E and total precipitation P (E/P; also called the evaporative index, EI) versus the ratio of potential evapotranspiration Ep and total precipitation P (Ep/P; also called the dryness index, DI) results in the Budyko space. In theory, two profound upper limits can be hypothesised: the supply limit where evapotranspiration equals precipitation (horizontal line in Fig. 16.2) and the demand limit where actual evapotranspiration (controlled by meteorological conditions and ecophysiology) equals potential evapotranspiration Ep (controlled only by meteorological conditions).
Here, Ep is defined as evapotranspiration by an ecosystem fully supplied with water to fulfil meteorological demands (calculated by Penman-Monteith; see following discussion). However, there exist many different definitions of Ep, for example, evaporation from open water, and many ways to calculate Ep, for example, only taking temperature into account, adding wind speed or vapour pressure deficits. Here, exceeding Ep/P = 1 indicates an ecosystem water deficit at annual time scales, while the term 1 - E/P quantifies the annual run-off or seepage in any given ecosystem.
Based on 167 ecosystem flux sites and 764 site-years, about 93% of all the sites were found to be at or below the demand and supply limits (Fig. 16.2b, c). The remaining 7% were outside the theoretical limits (e.g. more water used for evapotranspiration than supplied via precipitation), most likely owing to measurement biases and changes in soil water storage (which is assumed to be zero in the Budyko concept) (Williams et al. 2012). About 62% of the variation in E/P across sites, that is, the fraction of precipitation returned to the atmosphere by evapotranspiration, was driven by net radiation (energy-driven), and an additional 13% was explained by climate and vegetation types (physiology-driven).
This showed that despite the dominance of radiative controls on E, further vegetation type-related controls on E must be included in models of water fluxes. Interestingly, grasslands had on average a higher E/P (65%) than forest ecosystems: E/P of 56% for deciduous broadleaf forests (DBF) and 63% for evergreen needleleaf forests (ENF) (Fig. 16.2c), quite similar to croplands (E/P of 69%). This is consistent with measured leaf transpiration rates (Larcher 2003) and various strategies observed for grasses vs. trees on how to deal with water stress (Chap. 10, Fig. 10.16). However, this contrasts with the better coupling of forests (leading to higher E), with trees having deeper root systems and, thus, access to deeper soil depths and maybe higher leaf area index (LAI) than grasslands.
Date added: 2025-02-05; views: 526;