Plant Traits and Competition
Can traits (sensu Chap. 20) be identified that indicate probable establishment or superior growth in plant communities? As a first pass, different limiting resources require different traits: light competition will favour taller plants, while low nitrogen levels in the soil should favour longer roots (Table 19.2). In a study of shoreline plants, Gaudet and Keddy (1988) found that plant biomass was the single best predictor of competition outcome. They reason that nutrient uptake as well as light competition will benefit from more biomass. But is nutrient competition also preemptive, that is, will those plant win that can take up nutrients fastest? In this shoreline system that may very well be the case. However, in arid environments, plant tolerance to drought and their ability to extract nutrients at low nutrient levels may be more important than the ability to thrive under high-N conditions. Tilman (e.g. 1997) demonstrated that indeed those plant species that tolerate the lowest resource levels (“R*”) may in some systems determine the outcome of competition (see subsequent discussion for more details and consequences for coexistence).
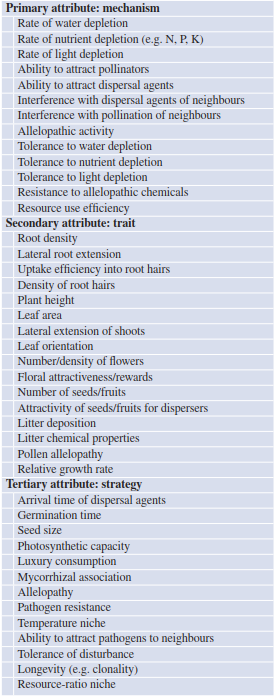
Table 19.2. Examples of plant characteristics related to competitive strength
Competitive strength will thus in many cases not be readily reflected in obvious characteristics such as plant height or root nodules. It is also a matter of exerting competitive effects on neighbouring plant individuals (competitive effect). It is appealing to attempt a concept of plant types according to their competitive behaviour, but before we do so, it should be made clear that this is a phenomenological framework, and the actual processes need to be confirmed in every system anew. The best known scheme of plant strategies is Grime’s (1977) C-S-R concept (Sect. 17.3 in Chap. 17) of competitive dominance (C), ability to tolerate stress (S) and ability to use resource pulses (R).
This is directly reflected in plant traits, with dominant plants being larger and richer in storage organs, stress adapted displaying specific morphological adaptations to that stress (e.g. aer- enchymas in water-logged soils, stomata-poor leaves with rolled margins in dry conditions, cushion growth form in exposed alpine environments) (Fig. 19.9), while resource-craving ruder- als display extreme phenotypic plasticity in size and growth rate with low allocation to storage and roots. In any given site, environmental conditions may thus lead to a clear competitive hierarchy, with the best-adapted trait combination occupying the most growth-favouring conditions, displacing other trait combinations to inferior sites (Box 19.3). To explore whether such concepts reflect actual competitive processes, experiments are inevitable.
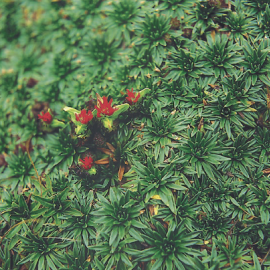
Fig. 19.9. A relatively robust cushion plant (Plantago rigida) in a Paramo community in Equador protects a much more sensitive species (Castilleja pumila) with red flowers. The former species may be termed a “nurse plant”, the latter a “cushion guest”. (Photo: K. Müller-Hohenstein)
Box 19.1: Designs for Competition Experiments. The actual set-up of an experiment depends on the specific hypothesis it sets out to test. We introduce the additive, the substitutive and the response surface design and the questions they try to address. In all designs, we distinguish between the target species and the competitor that exerts an influence on the target.
In additive designs, the competitor is added to whatever density the target grows to (Fig. 19.10a). It answers questions such as: Does the competitor have an effect on the target species? How does the effect depend on competitor density? In substitutive designs (Fig. 19.10b), density is kept constant, but the proportions of the two species change. This is a useful design to evaluate the strength of interrelative to intraspecific competition. Combining different densities of both species leads to the response surface design (Fig. 19.10c), clearly the most complex and labour-intensive set-up. Only this design allows the parameter- isation of a competition model with varying densities. In principle, this design can also be used for descriptive studies along gradients of densities of two (or more) species (e.g. Rees et al. 1996).
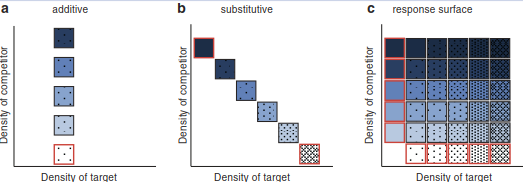
Fig. 19.10. Different designs for competition experiments. Blue shades represent density of competitor, dot density that of the target species. Monocultures are indicated by a red box
Designs of this type are typically not analysed using the Lotka-Volterra equations of Sect. 19.2 but by a function fitted to additive and surface design experiments derived by Firbank and Watkinson (1985):
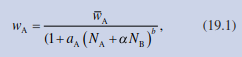
(19.1) where w is the biomass of species A and N is the number of individuals; wA is the average biomass of A without competition; and a, aA and b are fitted parameters.
Date added: 2026-04-26; views: 164;