Understanding Global Warming and Climate Change: A Scientific Overview
The term global warming generally refers to the phenomenon whereby the planet has been warming dramatically over the past century, whereas the more encompassing term climate change refers to longer-term shifts in climatic patterns. Most scientists suggest that human contributions to climate change have been accelerating to critical levels as the world becomes increasingly industrialized. Much of what is known about these short-term climate changes has been described in a report called Climate Change 2007: The Physical Science Basis, issued in late 2007 by the Intergovernmental Panel on Climate Change (IPCC), an international group of hundreds of scientists who have analyzed all available data. This group assessed the causes of these recent, short-term changes to the global climate and made predictions of what the Earth's climate may look like at various times in the future, with much of the information based directly on the IPCC's findings.
Eleven of the 12 years between 1996 and 2006 were the warmest on record since weather-recording instruments were widely used starting in 1850. The temperature rate increase appears to be accelerating, with polar areas affected more significantly than equatorial regions. Sea levels are also rising at an increasing rate; between 1961 and 1993, global sea level was rising at a rate of 0.05–0.09 inches per year (0.13–0.23 cm/yr), and since 1993, it has been rising at 0.09–0.11 inches per year (0.24–0.28 cm/yr). Some of this sea level rise is due to melting glaciers, ice caps, and snow, while some results from the thermal expansion of ocean water as it warms. Glaciers are shrinking in both the Northern and Southern Hemispheres, and the ice caps on the Arctic Ocean and over parts of Antarctica are shrinking rapidly.
Global precipitation patterns are observably changing on the century scale, with much of eastern North and South America, northern Europe, and north and central Asia seeing increased rainfall. Conversely, other areas such as the Sahel, the Mediterranean, southern Africa, and southern Asia are experiencing decreased precipitation. On a global scale, areas experiencing drought or less precipitation are greater than areas receiving greater precipitation.
Temperature Variations During the Past 1,000 Years. Understanding changes in the Earth’s climate in the past 100–200 years, or the slightly longer interval extending back through the last glacial interval, relies on several types of data. Instrumental records of Earth’s climate extend back to about the year 1850, when recording devices were put into widespread use. Long cores of ice obtained from Greenland and other locations are also widely used to measure past climate conditions, with this record extending back for approximately 650,000 years.
The IPCC issued the following statement in November 2007: "Warming of the climate system is unequivocal, as is now evident from observations of increases in global average air and ocean temperatures, widespread melting of snow and ice, and rising global average sea level." Global atmospheric concentrations of greenhouse gases have increased markedly as a result of human activities since 1750 and now far exceed pre-industrial levels. The global increases in carbon dioxide concentration are due primarily to fossil fuel use and land-use change, while those of methane and nitrous oxide are primarily due to agriculture.
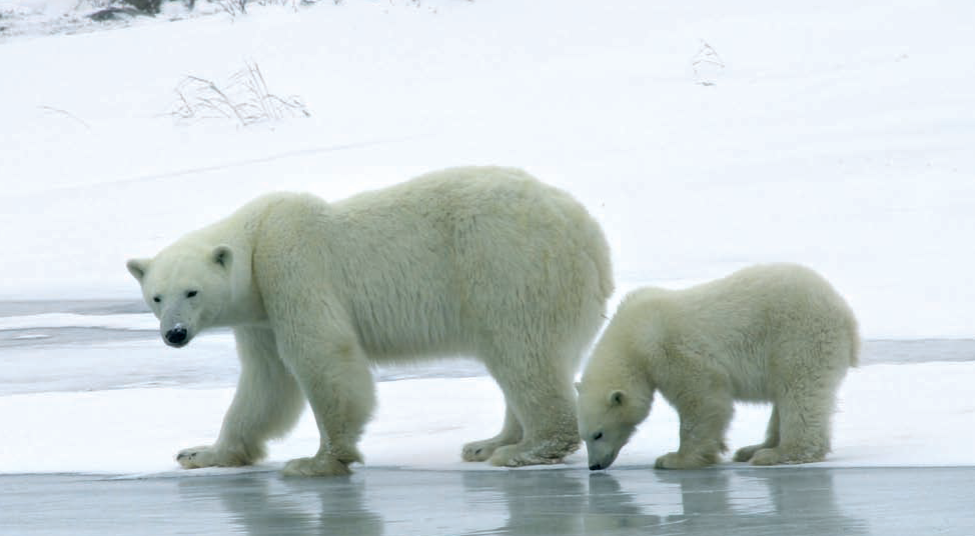
Mother polar bear and cub, threatened by global warming
This bold and controversial statement was based on rigorous analysis of data from the past 1,000 years, showing that temperatures remained fairly steady at about 0–0.5 degrees below the 1990 average value from the year 1000 to about 1910. Temperatures then began a sharp upward turn that flattened off for a short time in the 1950s and has turned sharply upward again since about 1976. Temperatures are now about 0.5–1.0 degrees above the 1990 value and are expected to rise 2–5 degrees above this value by 2100.
To measure global average temperatures, groups of meteorologists such as the World Meteorological Organization (WMO) and the Global Climate Observing System (GCOS) maintain a large number of observation points on the continents, which are then gridded into equal areas to assign a temperature for each box in the grid. Observations from satellites are widely used where local observations are not available and for calibrating the models. Local effects, such as any urban heat island effect from cities, are accounted for in these types of models. With rapid improvements in computer modeling, it has become possible to create increasingly detailed and accurate models for the Earth.
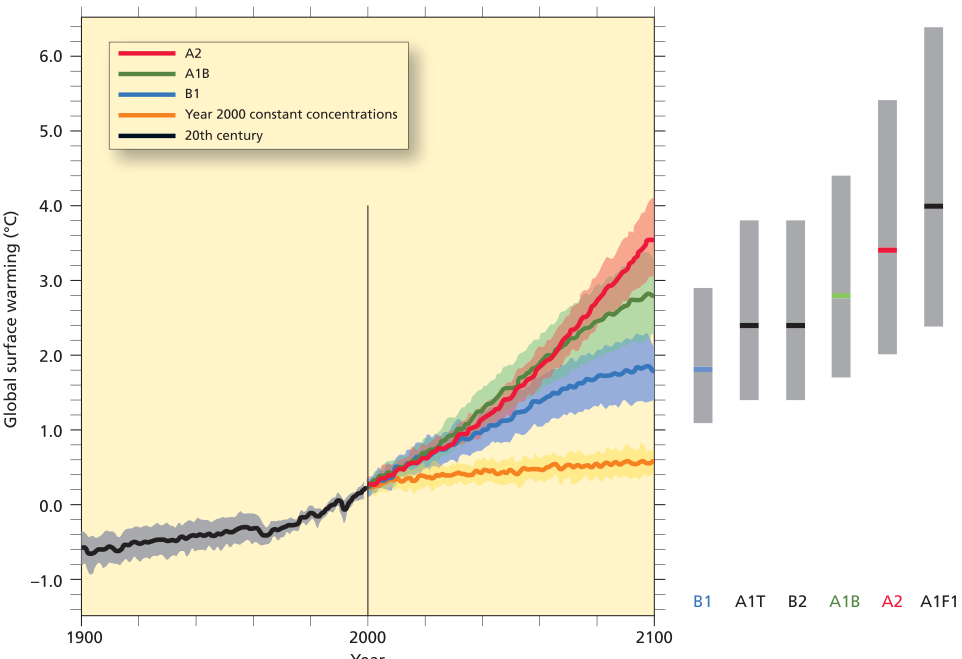
Plot of the average global temperature variations on the planet in the past 1,000 years and what different models predict the temperature will be by 2100. All models show a predicted temperature rise, ranging between 1.5 and 5.5 degrees. (Data from IPCC 2007)
Observed Short-Term Climate Changes and Their Effects. Instrumental and ice core records show that several components of the atmosphere and surface have undergone significant changes in the recorded climate history. First, the concentration of greenhouse gases such as carbon dioxide has increased dramatically since 1850, causing an increase in the atmospheric absorption of outgoing radiation and warming the atmosphere. Aerosols, microscopic droplets or airborne particles, have also increased, and these have reflected and absorbed incoming solar radiation.
The most obvious change in the short-term climate is the increase in temperature of the atmosphere and sea surface. The period between 1995 and 2006 ranks among the hottest on record since instrumental records have been in widespread use since 1850, containing 11 of the 12 hottest years recorded. Moreover, the rate of temperature rise has increased each decade since 1850, with the total temperature increase since 1850 estimated by the IPCC to be 1.4°F (0.76°C). Measurements of atmospheric water vapor indicate it is increasing with the rising temperature of the atmosphere, although such measurements extend back only to the mid-1980s.
Sea level has been rising at about 0.07 inches per year (0.18 cm/yr) since 1961 and at 0.12 inches per year (0.31 cm/yr) since 1993. The temperature of the oceans to a depth of 1.9 miles (3 km) has been increasing since at least 1961, with seawater absorbing most (approximately 80 percent) of the heat energy associated with global warming. This increase in seawater temperature is causing the water to expand, contributing to sea-level rise, while a dramatic melting of mountain glaciers in both the Northern and Southern Hemispheres also contributes. Changes in the ice caps on Greenland and Antarctica show an increased outflow of glacial ice and meltwater, so melting of the polar ice caps is very likely contributing to the measured sea-level rise, with both ice caps showing significant thinning.
Many specific regions of the planet are showing dramatic changes in response to global average warming surface conditions. For instance, the surface temperatures measured in the Arctic have been increasing at about twice the global rate for the past 100 years, although some fluctuations on a decadal scale have been observed. The sea ice that covers the Arctic Ocean may be on the verge of collapse, as the sea ice thins and covers a smaller area each year; since 1978, the Arctic sea ice has diminished in aerial extent by 2.7 percent each decade.
On land in Arctic regions, the thick permafrost layer is also warming by 4–5°F (~3°C), and a total decrease in the area covered by permafrost since 1900 is estimated to be about 7 percent. Permafrost locks a huge amount of peat and carbon into a closed system, so there are fears outlined in the IPCC report that the melting of the permafrost layer may release large amounts of carbon into the atmospheric system. The sea ice around Antarctica shows greater variations on interannual scales, and no longer-term trends are yet discernible, as much of the Antarctic region is isolated from other parts of the global climate belt.
Precipitation patterns across much of the planet are changing as a result of global warming. Observations from 1900 to 2007 show long-term drying and potential desertification over parts of the sub-Saharan Sahel, the Mediterranean region, parts of southern Asia, and much of southern Africa. Deeper and longer droughts have been occurring over larger areas since the 1970s, and some of these conditions can be related to changes in ocean temperature, wind patterns, and loss of snow cover. Westerly winds in the mid-latitudes have become stronger in both the Northern and Southern Hemispheres since the 1960s.
Weather extremes show an increase in frequency, including heavy precipitation events over land, as well as heat waves and extreme temperatures. Many studies suggest that oceanic cyclones or hurricanes may also be becoming stronger and more frequent, but some decadal variations in oceanic cyclones may complicate determination of these trends. Most studies support an increase in tropical cyclone activity since the 1970s over the North Atlantic and relate this to the increase in sea surface temperatures.
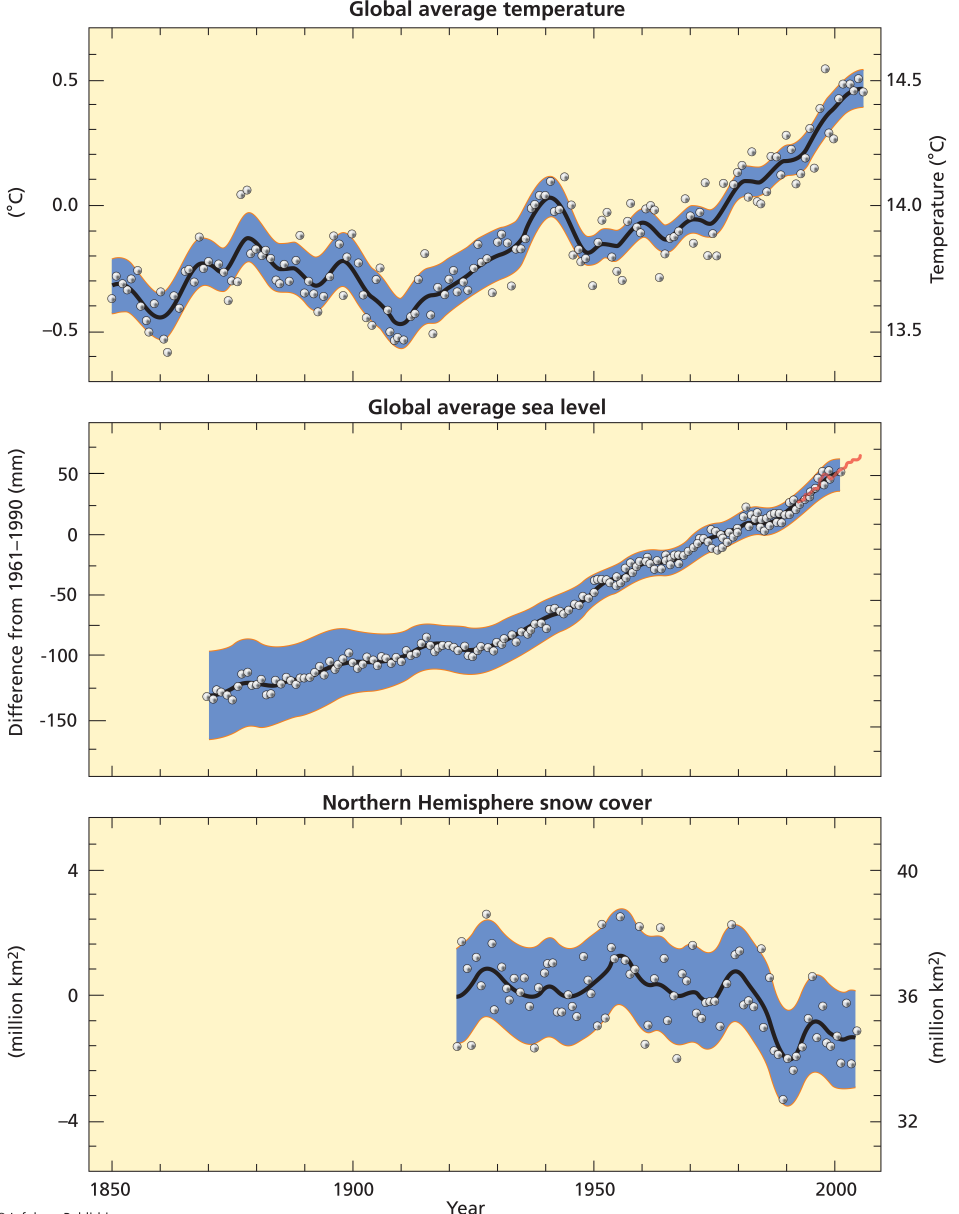
Graphs of global average temperature, sea level, and snow cover for the past 160 years (Data from IPCC 2007)
Causes of Short-Term Climate Change. The IPCC issued new reports, Climate Change 2007, in 2007 revealing that concentrations of some greenhouse gases have increased dramatically as a result of human activities, mostly starting with the early industrial revolution around 1750 and accelerating in the late industrial revolution around 1850. The greenhouse gases that show the most significant increases are carbon dioxide, methane, and nitrous oxide. Carbon dioxide (CO₂), the most significant anthropogenic greenhouse gas, is produced mainly by burning fossil fuels such as coal, oil, and gasoline.
The atmospheric concentrations of CO₂ have increased from a preindustrial revolution level of 280 parts per million (ppm) to a present (2005) level of 379 ppm, far exceeding the natural range (180–300 ppm) measured over the past 650,000 years. However, CO₂ levels have been higher in the geological past for reasons related to global volcanism, supercontinent cycles, and similar processes that operate on longer timescales than the changes measured since the industrial revolution. Despite significant variations on a year-to-year basis, the rate of CO₂ increase in concentration in the atmosphere has been accelerating over the past 10 years.
Methane in the atmosphere has increased in concentration from a pre-industrial revolution value of about 715 parts per billion (ppb) to 1,774 ppb in 2005. Methane is produced predominantly in agricultural production and also in burning fossil fuels, and its rapid increase in atmospheric concentration is, like carbon dioxide, well beyond the natural range (320–790 ppb) of the past 650,000 years. Nitrous oxide is released by agricultural activities and is a greenhouse gas; its concentration has increased in the atmosphere from a pre-industrial revolution level of 270 ppb to 319 ppb in 2005.
Scientists on the IPCC estimate that the total increase in heating of the atmosphere due to anthropogenic increases in greenhouse gases since the start of the industrial revolution in 1750 is greater than other effects, and the rate of planet warming is now faster than any experienced in the past 10,000 years. Radiative forcing is the net change in downward minus upward irradiance at the tropopause caused by a change in an external driver such as a change in greenhouse gas concentration. The radiative forcing caused by the change in CO₂ between 1995 and 2005 is estimated to be about 20 percent, the largest amount in the past 200 years.
Some of the warming caused by increases in greenhouse gases may be counteracted by an increase in aerosols, small airborne solid or liquid particles, which may have a cooling effect. Aerosols include particles such as sulfate, organic carbon, black carbon, nitrates, and dust. As the climate warms, more dust is being picked up from regions undergoing increased aridness and desertification, such as the fringes of the Gobi Desert and the Sahara, and this dust gets emplaced high into the atmosphere, where it may reside for some time and have a small cooling effect.
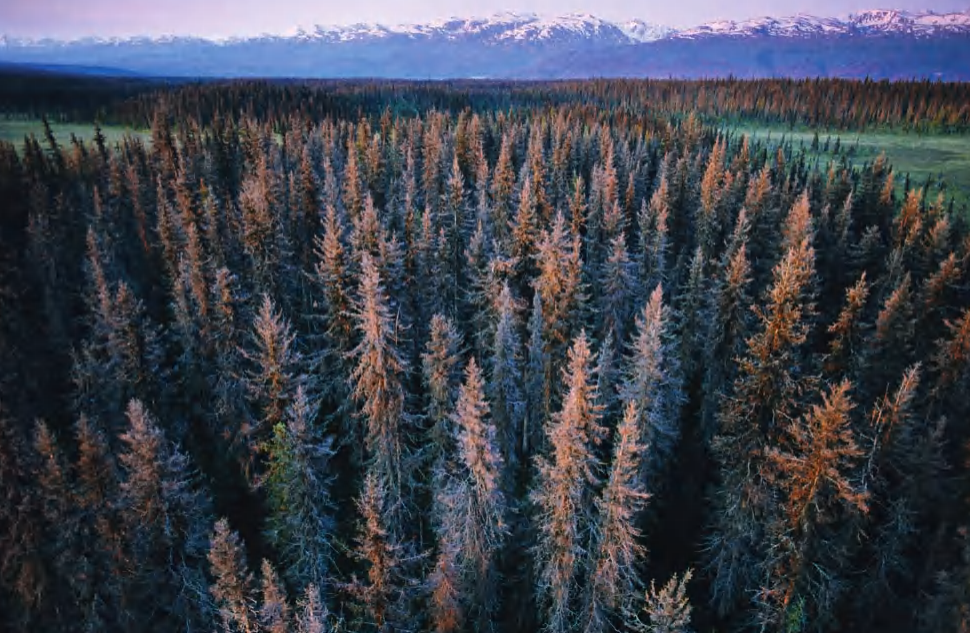
Spruce killed by spruce bark beetle near Homer, Alaska
The Greenhouse Effect. The term greenhouse effect refers to the Earth’s climate being sensitive to the concentrations of certain gases in the atmosphere. The concept was first coined by French physicist Edme Mariotte (1620–84) in 1681, who noted that light and heat from the Sun easily pass through a sheet of glass, but that heat from candles and other sources does not. This concept was then extended by French mathematician and physicist Joseph Fourier in 1824 to the atmosphere by noting that heat and light from the Sun can pass from space through the atmosphere, but heat radiated back to the atmosphere from Earth may get trapped by some atmospheric gases.
In 1861, Irish physicist John Tyndall (1820–93) identified that molecules of water (H₂O) and carbon dioxide (CO₂) were mainly responsible for the absorption of heat radiated back from Earth, while other atmospheric gases such as nitrogen and oxygen did not play a role in this effect. Tyndall noted that simple changes in the concentrations of CO₂ and H₂O could alternately cool and heat the atmosphere, producing “all the mutations of climate which the researches of geologists reveal.”
The next step in understanding the greenhouse effect came from the work of Swedish physicist Svante Arrhenius in 1896, who calculated that a 40 percent increase or decrease in the atmospheric concentration of CO₂ could cause the advance or retreat of continental glaciers, triggering glacial and interglacial ages. Much later, a change in atmospheric CO₂ of this magnitude was documented in cores of the Greenland ice sheet, as predicted by Arrhenius. The modern concept of linking greenhouse gases with the burning of fossil fuels was formulated by British steam engineer and amateur meteorologist Guy Stewart Callendar (1898–1964) in 1938.
Callendar calculated that a doubling of atmospheric CO₂ by burning fossil fuels would cause an average global temperature increase of about 3°F (2°C), with more heating at the poles, making prescient predictions that humans are changing the composition of the atmosphere at a rate that is “exceptional” on geological timescales. His prediction was that the “principal result of increasing carbon dioxide will be a gradual increase in the mean temperature of the colder regions of the Earth.” These predictions were first confirmed in 1947 when Ahlmann reported a 1–2°F (1.3°C) increase in the average temperature of the North Atlantic sector of the Arctic.
Comparison of Short-Term Climate Changes with the Medium-Term Paleoclimate Record. Separating the effects of short-term human-induced climate changes from natural variations on longer-term timescales can be difficult. Present-day global warming is unusual for the climate record of the past 1,300 years, but it has counterparts induced by natural causes about 125,000 years ago and in the older geological record. The last time climates warmed as significantly as the planet is now experiencing, approximately 125,000 years ago, loss of polar ice led to sea-level rise of 13–20 feet (4–6 m), suggesting that the world’s coastlines are in grave danger of moving inland to higher ground.
Ice core data show that temperatures in Greenland were 4–7°F (3–5°C) hotter than at present, a level that many models predict will be reached by the end of this century. The last 50 years appear to be the hottest in the past 1,300 years, but significant fluctuations have occurred. The measured increases in anthropogenic greenhouse gases can more than account for the measured temperature rise of the surface of the Earth in the past 50–100 years, with less-than-expected warming probably related to lowering of the temperature by aerosols from volcanic eruptions and dust from desert environments.
These measurements strongly suggest that present-day global warming is being forced by the human-induced injection of greenhouse gases into the atmosphere, not by other long-term climate-forcing mechanisms that have controlled other global warming and cooling events in past geological times. The measured surface warming is nearly global in scale, with Antarctica as the exception, as it is sheltered from parts of the global atmosphere-ocean system. Many local variations exist, such as “warming holes,” where local atmospheric effects are stronger than the global changes.
Sea-Level Changes. Global sea levels are currently rising as a result of the melting of the Greenland and Antarctic ice sheets and thermal expansion of the world’s ocean waters due to global warming. The Earth is presently in an interglacial stage of an ice age, and sea levels have risen nearly 400 feet (130 m) since the last glacial maximum 20,000 years ago, and about six inches (15.25 cm) in the past 100 years. The rate of sea-level rise seems to be accelerating and may presently be as much as an inch (2.5 cm) every 8–10 years. If all the ice on both ice sheets were to melt, global sea levels would rise by 230 feet (70 m), inundating most of the world’s major cities and submerging large parts of the continents under shallow seas.
The coastal regions of the world are densely populated and are experiencing rapid population growth, with approximately 100 million people presently living within 3 feet (1 m) of present-day sea level. If sea level were to rise rapidly and significantly, the world would experience an economic and social disaster on a magnitude not yet experienced by the civilized world. Many areas would become permanently flooded or subject to inundation by storms, beach erosion would be accelerated, and water tables would rise.
The Greenland and Antarctic ice sheets have significant differences that cause them to respond differently to changes in air and water temperatures. The Antarctic ice sheet is about 10 times as large as the Greenland ice sheet, and since it sits on the South Pole, Antarctica dominates its own climate. Most meltwater in Antarctica seeps into underlying snow and simply refreezes, with little running off into the sea. In contrast, Greenland’s climate is influenced by warm North Atlantic currents and its proximity to other land masses, experiencing significant summer melting and abundant snowfall.
The Greenland ice sheet is thinning rapidly along its edges, losing an average of 15–20 feet (4.5–6 m) in the past decade. About half of the ice lost from Greenland is through surface melting that runs off into the sea, while the other half is through calving of outlet glaciers and melting along tidewater glaciers and ice shelf bases. If just the Greenland ice sheet melts, the water released will contribute another 23 feet (7 m) to sea-level rise, to a level not seen since 125,000 years ago.
These differences between the Greenland and Antarctic ice sheets lead them to play different roles in global sea-level rise. Greenland contributes more to rapid, short-term fluctuations in sea level, responding to short-term changes in climate, while most of the world’s water available for raising sea level is locked up in the slowly changing Antarctic ice sheet, which contributes more to gradual, long-term sea-level rise. Data released by the IPCC in 2007 suggest that the current melting of glaciers is largely the result of the recent warming of the planet in the past 100 years through greenhouse warming.
Measuring global (also called eustatic) sea-level rise and fall is difficult because many factors influence the relative height of the sea along any coastline. Vertical motions of continents, called epeirogenic movements, may be related to plate tectonics, causing apparent sea-level change, but these changes are relatively slow compared with changes induced by global warming and glacial melting. Steady winds and currents can mass water against a particular coastline, causing local and temporary sea-level rise, such as the phenomenon associated with the El Niño–Southern Oscillation (ENSO).
Attempts to estimate eustatic sea-level changes must be able to average out the numerous local and tectonic effects to arrive at a globally meaningful estimate of sea-level change. Recently, satellite radar technology has precisely measured sea surface height and documented annual changes in sea level, with radar altimetry mapping sea surface elevations to the sub-inch scale globally. Satellite techniques support the concept that global sea levels are rising at about 0.1 inches (0.25 cm) per decade.
Further Reading: Abrahams, A. D., and A. J. Parsons. Geomorphology of Desert Environments. Norwell, Mass.: Kluwer Academic Publishers for Chapman and Hall, 1994.
Ahrens, C. D. Meteorology Today: An Introduction to Weather, Climate, and the Environment. 6th ed. Pacific Grove, Calif.: Brooks/Cole, 2000.
Botkin, D., and E. Keller. Environmental Science. Hoboken, N.J.: John Wiley & Sons, 2003.
Bryson, R., and T. Murray. Climates of Hunger. Canberra: Australian National University Press, 1977.
Culliton, Thomas J., Maureen A. Warren, Timothy R. Goodspeed, Davida G. Remer, Carol M. Blackwell, and John McDonough III. Fifty Years of Population Growth along the Nation’s Coasts, 1960–2010. Rockville, Md.: National Oceanic and Atmospheric Administration, 1990.
Dawson, A. G. Ice Age Earth. London: Routledge, 1992.
Douglas, B., M. Kearney, and S. Leatherman. Sea Level Rise: History and Consequence. San Diego, Calif.: Academic Press, International Geophysics Series, vol. 75, 2000.
Date added: 2026-04-26; views: 142;