
Evapotranspiration: Processes, Biome Variations, and Predictive Models
Evaporation occurs when a moist surface is exposed to drier air. As air parcels move away from the surface, they carry with them moisture from the surface. Water evaporates from the surface, increasing the amount of water vapor in the surrounding air. When the air is saturated with water vapor, evaporation ceases. Transpiration is evaporation of water from plant leaves as it moves from the soil through plants and out through leaves to the air. Plants consume large amounts of water during growth. A field of corn covering 4000 m2 can consume 10,000-15,000 liters of water (2.5-3.75 mm) in a day. A single well-watered tree can transpire 100-150 liters of water per day. Meteorological processes near the surface control evaporation and transpiration. Transpiration is also regulated by the physiology of plants. When plants cover a small portion of the surface, evaporation is the dominant flux. Transpiration becomes more important as plant cover increases. However, it is difficult to distinguish evaporation from transpiration, and the two terms are often combined into evapotranspiration.
Global evapotranspiration from Earth’s land surface is about 550 mm of water per year (Jung et al. 2010). Other estimates range from 544 to 631 mm per year (Mueller et al. 2011). Transpiration accounts for 80-90 percent of global evapotranspiration (Jasechko et al. 2013). This water loss varies considerably among various biomes (Figure 10.3).
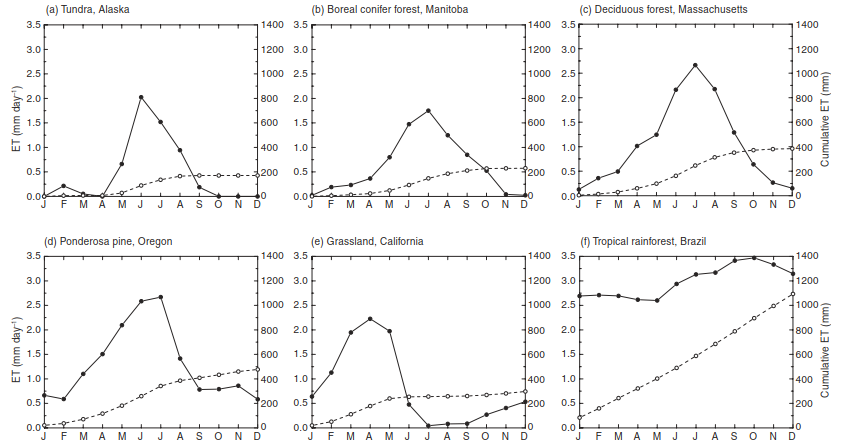
Fig. 10.3. Monthly evapotranspiration (solid line, left axis, mm day-1) and cumulative evapotranspiration (dashed line, right axis, mm) for (a) moist tundra, Alaska, (b) boreal conifer forest, Manitoba, (c) temperate deciduous forest, Massachusetts, (d) ponderosa pine, Oregon, (e) grassland, California, and (f) tropical rainforest, Brazil. See Figure 12.3 for monthly energy fluxes and site details
Monthly evapotranspiration in tropical rainforest averages 2.5-3.5 mm per day and has little seasonal variation. Annual water loss is 1100 mm. Other biomes have comparable peak monthly rates, but strong seasonal variation yields much less annual water loss (200-500 mm). Seasonally cold biomes (temperate deciduous forest, boreal forest, and tundra) have a distinct annual cycle with high evapotranspiration during the warm summer months and low rates in the cold winter season. Temperate deciduous forest has peak monthly rates of 2-2.5 mm per day during the growing season. Boreal forest and tundra have lower maximum rates (1.5-2 mm per day) and a shorter growing season. Annual water loss declines from deciduous forest (380 mm) to boreal forest (230 mm) to tundra (170 mm). Ponderosa pine and grassland have distinct annual cycles related to precipitation. Peak rates in ponderosa pine (2.5 mm per day) and grassland (>2 mm per day) are comparable to other sites, but decline markedly in the dry season. Annual water loss is, however, similar to, or greater than, other sites (300 mm, grassland; 480 mm, ponderosa pine).
The rate of evapotranspiration depends on the availability of energy to evaporate water and the ability of water vapor to diffuse into the atmosphere. At 15°C, 2466J are needed to change one gram of water to vapor (Table 3.3). Tropical climates, with a surplus of net radiation, have more energy to evaporate water than arctic climates. The capacity of air to remove water from the evaporating surface is also important. This is related to the humidity of the air. Dry air has a greater evaporative demand than humid air. It is also related to wind speed. As water evaporates from a surface, parcels of air near the surface become more humid. Under calm conditions, evapotranspiration decreases as the air becomes saturated with water vapor. With windy conditions, these parcels of air are carried away and replaced by less humid parcels.
The type of soil and its water content also regulate evapotranspiration. The rate of evaporation is determined by the rate at which water is supplied to the surface. An insufficient rate of soil water flow upward to the evaporating surface decreases the rate at which water can evaporate. The hydraulic properties of soil and the extent of drying determine the rate of replenishment (Chapter 9). A dry soil or a soil with low hydraulic conductivity provides less water for evapotranspiration than does a wet soil or one with high hydraulic conductivity.
The type of vegetation is also important. Leaves have microscopic pores called stomata that open to allow the plant to absorb CO2 during photosynthesis. The plant cannot grow if stomata are not open, but when stomata are open, water inside the leaf diffuses out to the surrounding drier air during transpiration. If too much water is lost, the plant becomes desiccated and will die if its internal water is not replenished from water in the soil. Plants have evolved compromises between the need to open stomata to take up CO2 and the need to close them to prevent water loss (Chapter 16).
Water lost from leaves during transpiration must be replenished from the soil. As transpiration increases during the day, water is first drawn from internal plant storage and then from soil near the roots. The movement of water from the soil through plants into the atmosphere occurs along a continuum of decreasing water potential. Water potential is a negative suction. The atmosphere exerts the most suction and has the lowest water potential. When wet, soil particles exert minimal suction on water and have a high water potential. Water flows from soil (on the order of -0.01 MPa when wet) into roots (-0.1 MPa) through the plant and out through foliage (-1 MPa) into the surrounding air (-100 MPa), moving from high to low water potential. At night, plant water uptake replenishes water depleted during the day. By morning, before transpiration begins, water in soil near the roots, water in plant storage, and water in foliage are again nearly equal in potential. The gradient in water potential re-establishes during the day as transpiration increases.
As a plant extracts water from the soil, some critical water content is reached at which further decrease in soil water increases plant stress. In trees, water stress is seen in the pre-dawn water potential of foliage, which is a reliable indicator of soil moisture. Pre-dawn foliage water potential decreases as soil moisture drops below some threshold (Sucoff 1972; Hinckley and Ritchie 1973; Running et al. 1975). In the data shown in Figure 10.4, for example, pre-dawn foliage water potential of red pine trees growing on loamy sand is invariant of soil moisture at high water contents and decreases linearly with volumetric soil water less than about 0.1 m3 m-3.
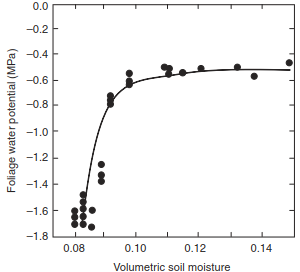
Fig. 10.4. Pre-dawn foliage water potential in red pine trees in relation to volumetric soil water content for loamy sand. Volumetric water content is based on the depth of water in the upper 46 cm of soil. adapted from Sucoff (1972)
Several classes of models are used to estimate evapotranspiration (Fisher et al. 2011). One method uses air temperature as a surrogate for the energy available to evaporate water. The Thornthwaite equation exemplifies this approach (Thornthwaite 1948). In this formulation, monthly potential evapotranspira- tion (Ep, mm) is:

where L is daylength (hours), N is the number of days in a month, T is mean monthly air temperature (°C), a is defined as:
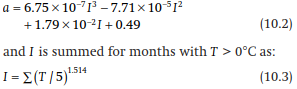
Evapotranspiration from Thornthwaite’s method is a potential evapotranspiration because it does not account for the reduction in evapotranspiration as a result of soil drying. However, simple relationships can be used to decrease potential evapotranspiration to the extent that soil water is limiting. One approach is to assume that evapotranspiration proceeds at its potential rate until the soil is depleted of water. However, this ignores the tighter binding of water to soil particles as the soil dries. An alternative is to assume a linear decrease in evapotranspiration as the soil becomes drier, scaled to give the potential rate when the soil is fully wet and zero when the soil is dry.
Another class of models relates evapotrans- piration to available energy, given by net radiation. The Priestley-Taylor equation exemplifies this type of model (Priestley and Taylor 1972). This equation relates potential evapotranspiration (Ep, mm day-1) to net radiation (Rn) as:

Dividing by the latent heat of vaporization (λ, MJ kg-1) converts Rn from an energy flux (MJ m-2 day-1) to a mass flux (kg m-2 day-1), equivalent to a depth of water (mm day-1) because the density of water is 1000 kg m-3 (1 kg m-2/1000 kg m-3 = 0.001 m). In this equation, - (kPa K-1) is the change in saturation vapor pressure with respect to temperature (Table 3.3) and у is the psychrometric constant (a representative value is 0.0665 kPa K-1, Chapter 12). The coefficient a equals 1.26 for a wet surface, but is lower for vegetation. For example, a equals 0.82 in tropical and temperate broadleaf forests and equals 0.65 and 0.55 in temperate and boreal conifer forests, respectively (Komatsu 2005; Baldocchi and Ryu 2011).
The Penman equation is a combination equation that includes both available energy and diffusion (Penman 1948). As given by Shuttleworth (1993, 2007), potential evapotranspiration (Ep, mm day-1) over open water is:

This equation is similar to the Priestley-Taylor equation, but additionally includes wind speed (u, m s-1) and vapor pressure deficit (D, kPa). Evapotranspiration is a weighted linear combination of available energy and vapor pressure deficit. Evapotranspiration increases as more energy is available and as the atmospheric demand (i.e., vapor pressure deficit) increases, all other factors being equal. The Penman-Monteith equation (Chapter 12) is an extension of the Penman equation and illustrates the thermodynamic, aerodynamic, and biological processes controlling evapotranspira- tion. It can be applied to calculate evapotranspi- ration for a reference crop (Shuttleworth 1993, 2007). The Penman-Monteith equation is also used with satellite remote sensing to estimate continental-scale evapotranspiration (Zhang et al. 2010; Mu et al. 2011; Ryu et al. 2011). Radiation, atmospheric humidity, and wind speed are critical determinants of evapotranspiration, and temperature-based estimates (such as Thornthwaite’s method) give different (and poorer) estimates of the water balance than do radiation-based and combination-based methods (Fisher et al. 2009; Sheffield et al. 2012).
Date added: 2026-09-24; views: 1;