
Soil Infiltration, Surface Runoff, and Estimation Methods
The rate at which water infiltrates depends in part on the rate at which it is supplied to the soil surface. When the rainfall rate is less than the infiltration capacity, all the water infiltrates into the soil. Water delivered in excess of infiltration capacity initially accumulates as puddles in small depressions on the surface. Once this depression storage capacity is exceeded, the excess water flows downhill as overland flow, or surface runoff. The time when this occurs, known as time to ponding, depends on soil texture, antecedent soil water, and delivery rate. High infiltration capacity does not allow ponding on sand or sandy loam except under extremely high precipitation rates. In general, infiltration rate decreases, time to ponding decreases, and runoff increases from sand to loam to clay or with initially wetter soil.
The Green-Ampt equation (Chapter 9), and other such formulations, represents infiltration into idealized soil columns. In addition to micropores arising from the shape, arrangement, and aggregation of mineral and humus particles, soils have macropores formed by plant roots, earthworms, ants, and other burrowing organisms. These macropores can increase infiltration rates. Additionally, soil properties vary spatially, and other methods must be used to account for the effect of soil heterogeneity on infiltration (Chapter 11). Because of its importance to stormflow, several empirical formulas have been devised to determine runoff for application in landscape and urban planning. These equations illustrate the environmental controls of runoff.
One simple means to estimate runoff is the Rational method, which is commonly used in urban planning (Strom and Nathan 1993; Ferguson 1998). Runoff (R, m3 s-1) is:

where P is rainfall intensity (mm per hour), A is the drainage area (km2), and c is a coefficient that varies with land cover. The factor 0.278 converts units to m3 s-1. The equation states that peak runoff is equal to the fraction of the rainfall that runs off (cP) multiplied by the size of the drainage area (A). The runoff coefficient ranges from zero for a completely pervious surface to one for a completely impervious surface (Table 10.1). Urban landscapes generally generate more runoff than vegetated landscapes. Vegetated landscapes generate less runoff than bare ground.
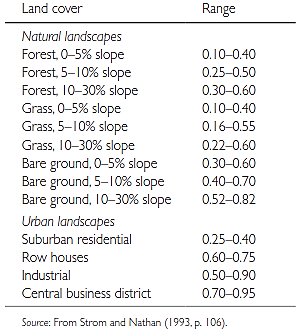
Table 10.1. Runoff coefficients for use with the Rational method
The United States Soil Conservation Service developed a method for estimating runoff based on soil type, land use, land cover, and antecedent soil moisture (SCS 1985, 1986). This method is also used in urban planning (Strom and Nathan 1993; Ferguson 1998). Runoff (R, mm) is:

where P (mm) is rainfall over a 24-hour interval, Ia (mm) is the initial loss of water to infiltration and in surface depressions before runoff begins (known as the initial abstraction), and Smax is the potential maximum retention after runoff begins. This latter term is related to a curve number (CN) that depends on soil type, land use, land cover, and antecedent soil moisture. For fluxes in millimeters:

The initial abstraction is Ia = 0.2Smax.
Figure 10.5a illustrates runoff in relation to precipitation for a variety of curve numbers. No surface runoff occurs when the duration of the storm is less than the time required to saturate the soil or if the intensity of rainfall is less than the soil’s infiltration capacity. Runoff increases with curve number until CN = 100, when there is a one-to-one relationship between precipitation and runoff. The initial detention of precipitation prior to runoff decreases with curve number. For CN = 30, runoff does not begin until rainfall exceeds 150 mm. For CN = 60, runoff begins with rainfall in excess of 50 mm. Runoff begins almost immediately for CN > 90.
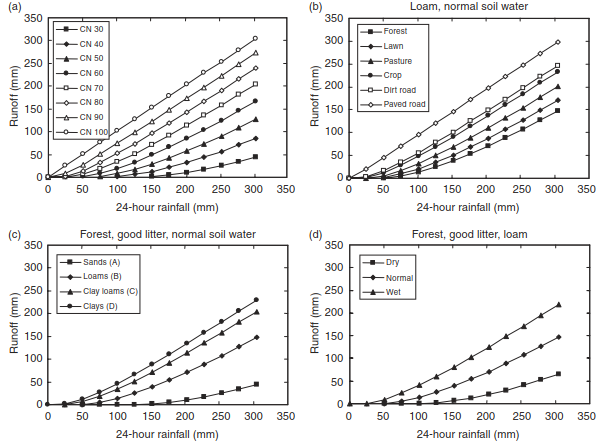
Fig. 10.5. U.S. Soil Conservation Service runoff in relation to precipitation. Curve numbers are given in table 10.2. (a) effect of curve number from 30 to 100 on runoff. (b) effect of land cover for a loam with normal soil water. (c) effect of soil texture for a forest with good litter and normal soil water. (d) effect of soil water for a forest with good litter and loam soil
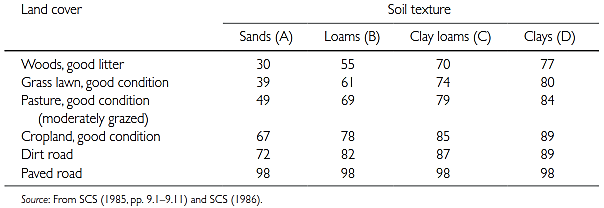
Table 10.2. Soil Conservation Service curve numbers (CN) in relation to soil texture and land cover for normal soil moisture conditions
Table 10.2 shows curve numbers for several land cover types and soils with normal soil water, and Figure 10.5 shows resulting runoff in relation to storm rainfall for a variety of conditions. For a given soil type (e.g., loam), a forest with a good litter cover generates the least runoff. The litter cover retards surface water flow, giving the water additional time to enter the soil. In addition, large, extensive tree roots make the soil more porous, allowing more water to enter the soil. Crops and dirt roads generate high runoff. Paved roads generate the most runoff. Sands have high infiltration rates and low runoff potential. Clays have low infiltration rates and high runoff potential. Loams are intermediate soils, with moderate to low infiltration rates. Curve numbers must be adjusted for antecedent moisture conditions (SCS 1985, pp. 4.10-4.12, p. 10.7). Dry soils have lower curve numbers than wet soils so that dry soils have less runoff than wet soils.
Date added: 2026-09-24; views: 2;