
Boundary Layer Characteristics
The atmospheric boundary layer is the layer of the atmosphere above Earth’s surface that is directly affected over the course of a day by the surface through heating, cooling, friction, and the emission of atmospheric constituents such as water vapor, CO2, dust, and pollutants. The boundary layer is the region of the atmosphere in which people live and plants grow. Processes in the boundary layer determine the climate near the ground that we experience.
The boundary layer has distinct regions. The surface layer is the layer immediately above the surface where air flow strongly depends on surface characteristics. Vertical variation in surface fluxes is negligible, and the surface layer is also referred to as the constant flux layer. Monin-Obukhov similarity theory describes flux-profile relationships in the constant flux layer (Chapter 13). However, these relationships fail in the layer of flow within and close to the plant canopy, known as the roughness sublayer. The outer layer is the region above the surface layer where flow is not as greatly influenced by the surface. It constitutes most of the boundary layer. The outer layer can have strong convective motion during periods of intense surface heating, such as during the day, and is often called the convective mixed layer. Under strong mixing, the temperature profile shows little vertical variation and turbulent fluxes decrease with height. The top of the boundary layer is defined by a stable layer under strong convective conditions.
Figure 14.1 illustrates typical profiles of potential temperature and specific humidity in the convective boundary layer. The surface layer is well marked by decreases in temperature and humidity, above which the profiles are uniform with height through the mixed layer. The boundary layer top is marked by a sharp increase in potential temperature and a decrease in specific humidity. At night, the surface cools by longwave emission and the boundary layer is typically characterized by a temperature inversion in which the surface is cooler than the air above (Figure 14.2). This temperature inversion is most prominent on clear nights.
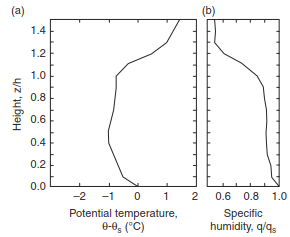
Fig. 14.1. Mean profiles of (a) potential temperature (θ) and (b) specific humidity (q) in the convective boundary layer measured above sparse grassland in southeastern australia at 1500 local time during the Wangara experiment (Clarke et al. 1971). Height (z) is scaled by mixed layer depth (h). Potential temperature is shown as the deviation from the surface temperature (θs). Specific humidity is scaled by the surface humidity (qs ). The average mixed layer depth is h = 915 m and the mean surface humidity is qs = 4.1 g kg–1. redrawn from Mahrt (1976)
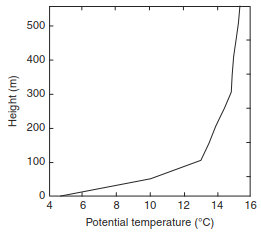
Fig. 14.2. Potential temperature profile at 0020 local time on day 8 of the Wangara experiment. redrawn from andré and Mahrt (1982)
Surface fluxes regulate the cloudless boundary layer. In the absence of clouds, the sensible heat flux at the surface largely determines the rate of warming or cooling of the boundary layer. A convergence of sensible heat warms the boundary layer while divergence leads to cooling. Similarly, the convergence or divergence of water vapor flux increases or decreases specific humidity. Evaporated water is carried from the surface into the boundary layer, where it releases latent heat during condensation and forms clouds. The presence of clouds significantly affects the boundary layer. Clouds alter radiative transfer through the atmosphere and produce local sources of heating and cooling within the boundary layer that influence its turbulent structure. Phase change associated with condensation and evaporation of water droplets are additional complications.
Date added: 2026-09-24; views: 2;