
Global Drainage Basins
Figure 11.16 shows the amount of water flowing in major rivers worldwide. With an annual flow of 155,430 m3 s-1, the Amazon River, which enters the Atlantic Ocean in Brazil along the equator, discharges the most water. The Congo River in western equatorial Africa, the Orinoco River in northern South America, and the Changjiang River in China are the next largest, each carrying from 25,000 to 33,000 m3 s-1.
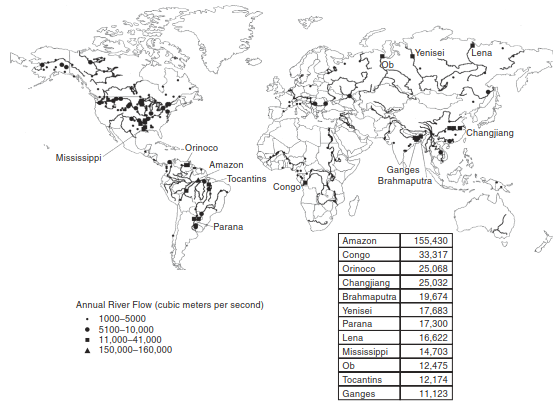
Fig. 11.16. Annual riverflow for 241 gauging stations worldwide. the 12 largest rivers and their annual flow at the station closest to their mouth are identified. data from Coe (2000)
Three of the 12 largest rivers (Ob, Yenisei, and Lena) drain Siberia and flow northward into the Arctic Ocean. The Mississippi, which drains much of the United States east of the Rocky Mountains, carries 14,703 m3 s-1 to the Gulf of Mexico and ranks ninth worldwide in terms of annual flow. Comparison with observed riverflow is an important means to test the hydrologic cycle of climate models (Coe 2000; Lawrence et al. 2011).
Figure 11.17 divides the continents into source regions of runoff for each major ocean basin. For example, 89 percent of South America contributes runoff to the Atlantic Ocean. Only a small region west of the Andes Mountains (7% of the continent) generates runoff for the Pacific Ocean. North American rivers feed the Pacific Ocean west of the Rocky Mountains (23% of continental area), the Atlantic Ocean east of the Rocky Mountains (56%), and the Arctic Ocean in the north (19%). European land area is also split among three oceans, with 35 percent of the land area contributing to the Atlantic Ocean, 30 percent to the Mediterranean Sea, and 15 percent to the Arctic Ocean. Africa and Asia similarly drain into three oceans, with Asian land area roughly evenly apportioned to the Pacific (31%), Arctic (25%), and Indian (22%) oceans. In Africa, water from nearly one-half (45%) of all land area flows into the Atlantic while 24 percent and 21 percent of the land area contributes to the Mediterranean and Indian Ocean, respectively. More than one-half (58%) of the land area of Australia drains into the Indian Ocean. Only 14 percent drains into the Pacific while 28 percent of the land area has no connection to the sea.
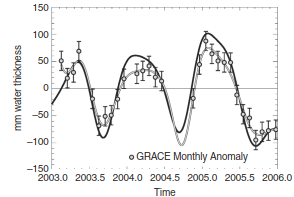
Fig. 11.18. Observed total water storage anomalies (soil water and groundwater) for a network of sites in illinois (black line) and total water storage anomalies derived from GRACe (circles and gray line) for the period 2003–2005. Reproduced from Swenson et al. (2006)
Rivers in northern Alaska, the Canadian Arctic, and Russia replenish water in the Arctic Ocean. Asia provides two-thirds (66%) of the total contributing basin area. North America comprises one-quarter (25%) of the contributing area while Europe is only 9 percent. The Atlantic Ocean is fed primarily by land area from South America (35% of total contributing basin area), Africa (29%), and North America (28%). Europe comprises only 8 percent of the total drainage basin, but has a greater relative role in the North Atlantic. One-half (47%) of the drainage area of the Indian Ocean is in Asia, one-third (31%) in Africa, and one-quarter (22%) in Australia. Two-thirds (64%) of the drainage area of the Pacific Ocean originates in Asia and one-quarter (24%) in North America. South America and Australia are only minor components of the Pacific Ocean drainage basin (each with 6% of total area).
Continental-scale variations in the water budget can also be monitored from space. Terrestrial water storage affects Earth’s gravitational field. Satellite-based measurements of month-to-month variation in Earth’s gravitational field from the Gravity Recovery and Climate Experiment (GRACE) give an indication of changes in surface and subsurface water storage on land (Ramillien et al. 2008). The GRACE data can be used to infer the water balance (Swenson and Wahr 2006; Rodell et al. 2009; Syed et al. 2009; Famiglietti et al. 2011). For example, Swenson et al. (2006) showed that GRACE data compare well with observed total water storage (soil water plus groundwater) in Illinois (Figure 11.18). Maximum storage occurs in spring, with minimum water storage in autumn. GRACE estimates of seasonal variation in water storage provide a means to assess the terrestrial hydrologic cycle simulated by global climate models (Niu and Yang 2006; Swenson and Milly 2006).
Date added: 2026-09-24; views: 1;