
Watershed Hydrology and Catchment Water Balance
The cycling of water depicted in Figure 10.1 can be applied to particular geographic regions to calculate the water balance. One such area is a watershed or drainage basin. A watershed is the geographic area that contributes to flow in a stream or river. It can be hundreds of thousands of square kilometers for a large river such as the Mississippi or Amazon or a few square kilometers for a small creek. A watershed is topographically defined; it is bounded along its edges by divides formed from high elevation points. A drop of water on the streamward side of the divide flows downslope to the stream; a drop of water on the other side of the divide flows into another stream.
Figure 11.1 depicts a typical watershed, bounded on its sides by elevation, on the bottom by bedrock, and above by the atmosphere. The water balance extending from the divides to groundwater is:

where ΔS is the change in water storage, P is precipitation, Gin is groundwater flowing into the watershed, E is water loss during evapotranspi- ration, qover is surface runoff, and qbase is subsurface groundwater flow. The total lateral outflow of water is also the total runoff (R = qover + qbase), and because watersheds are topographically defined by high elevations, groundwater inflow is typically negligible. Consequently, if there is no change in water storage, water input from precipitation is balanced by evapotranspiration and runoff (P - E = R).
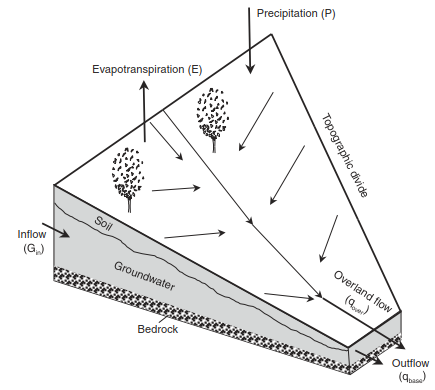
Fig. 11.1. A topographically defined watershed. the thick black line shows the topographic divide. arrows indicate water fluxes
Watershed Studies. The term P - E = R averaged over long time periods (e.g., annually) is the amount of water flowing in streams and rivers. Streamflow, therefore, provides a basis for monitoring and diagnosing the hydrologic balance of a watershed. In watershed studies, precipitation is typically measured by a network of rain gauges and spatially averaged across the watershed. Streamflow is monitored by gauging stations. Annual evapotranspiration is estimated as the difference between precipitation and streamflow.
One watershed where the water budget has been studied in detail is the Hubbard Brook Experimental Forest in the White Mountains of New Hampshire. The Hubbard Brook watershed extends over 3076 ha (1 ha = 10,000 m2) and is covered by northern hardwood forest (Likens et al. 1977; Bormann and Likens 1979; Likens and Bormann 1995; Likens 2004). Between 1956 and 1974, annual precipitation averaged 1300 mm with 500 mm (38%) being returned to the atmosphere in evapotranspiration and 800 mm (62%) leaving the watershed as runoff in streams (Figure 11.2a). Over the period studied, there was considerable interannual variability in annual precipitation, which ranged from 950 to 1860 mm. Evapotranspiration remained relatively constant from year to year, ranging from 418 to 542 mm. Evapotranspiration did not increase in wetter years or decrease in drier years. Annual streamflow increased in wetter years, and there was a linear increase in annual streamflow in response to precipitation. This suggests that precipitation is first used to replenish water lost during evapotrans- piration. Any excess water then contributes to streamflow.
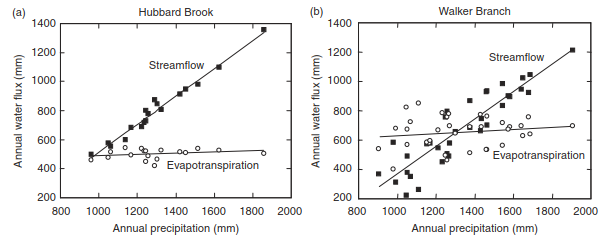
Fig. 11.2. Relationships among annual streamflow, evapotranspiration, and precipitation for (a) the hubbard Brook experimental Forest during 1956–1974 and (b) the Walker Branch watershed during 1969–2003. Data from likens et al. (1977, p. 22) and the oak ridge National laboratory (oak ridge, tennessee)
Similar relationships occur at the Walker Branch watershed near Oak Ridge, Tennessee. This is a 98 ha watershed with mixed deciduous forest (Johnson and Van Hook 1989). For the 35-year period (1969-2003), the average annual precipitation was 1331 mm (Figure 11.2b).
Streamflow for the watershed, monitored for two subcatchments, averaged 679 mm (51% of annual precipitation). Evapotranspiration, taken as the residual precipitation, averaged 652 mm (49%). This estimate of evapotrans- piration derived from the catchment water balance is similar in magnitude to eddy covariance estimates (Wilson et al. 2001). The Walker Branch watershed has higher annual evapo- transpiration than Hubbard Brook despite similar annual precipitation. The Walker Branch data show considerable more variability in their relationship with precipitation than the Hubbard Brook data. This is due to the large water-holding capacity of Walker Branch soils compared with Hubbard Brook soils (Luxmoore and Huff 1989).
The 2185 ha Coweeta Hydrologic Laboratory in the mountains of southwestern North Carolina illustrates the wide range in the hydrologic cycle than can be found even within a small region (Swank and Crossley 1988). In six subcatchments of mixed deciduous forest that vary in elevation, annual runoff ranges from about 50 percent of annual precipitation at low elevations to 70-75 percent at high elevations (Table 11.1).
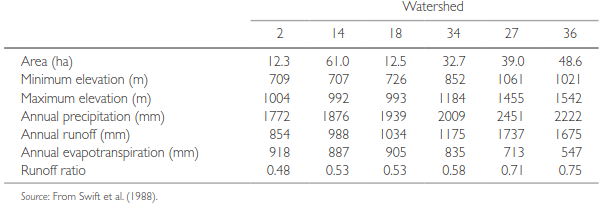
Table 11.1. Physiographic and hydrologic characteristics of six watersheds at the Coweeta Hydrologic Laboratory
In general, annual precipitation increases with higher elevation. Conversely, soil depth decreases with higher elevation so that water-holding capacity is greater at lowland than at upland sites. High elevations sites also have less evapotranspiration demand than lowland sites. Consequently, watersheds 2, 14, and 18 at low elevations, where more of precipitation is stored in deep soils, have a lower proportion of annual precipitation as runoff than do watersheds 27 and 36 at high elevations, where shallow soils limit water storage and promote runoff.
The importance of vegetation in regulating the water balance can be demonstrated by experimentally clearing a watershed. Such studies routinely show decreased evapotranspi- ration and increased streamflow in deforested watersheds compared with forested watersheds (Bosch and Hewlett 1982; Hornbeck et al. 1993; Zhang et al. 2001; Andreassian 2004; Brown et al. 2005). Comparison of forested and deforested watersheds at Hubbard Brook illustrates this response to clearing (Hornbeck et al. 1970, 1997; Bormann and Likens 1979). Prior to deforestation, both watersheds had similar evapotranspiration and streamflow (Figure 11.3).
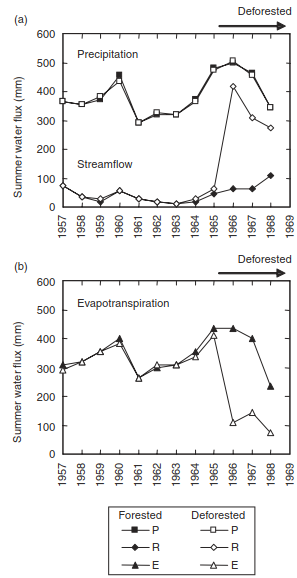
Fig. 11.3. Effect of deforestation on (a) summer precipitation (P) and streamflow (r) and (b) evapotranspiration (e) for two watersheds in the hubbard Brook experimental Forest. one watershed was deforested in 1965–66 and vegetation regrowth was suppressed for three years. The other watershed was not deforested. Adapted from Bormann and likens (1979, p. 85)
After clearing in 1965-66, evapotranspiration decreased and streamflow increased in the deforested watershed compared with the forested watershed. Greatest increase in stream- flow occurred during the growing season when evapotranspiration decreased due to forest clearing. The Coweeta study shows a similar response to clearing. During a 7-year period in which regrowth was cut annually, stream- flow increased compared with mature forest (Figure 11.4a). Clearcutting had minor effect in late winter and early spring when the soil was recharged and greater effect in the growing season. Conversely, afforestation of grassland and shrubland reduces streamflow (Farley et al. 2005; Jackson et al. 2005).
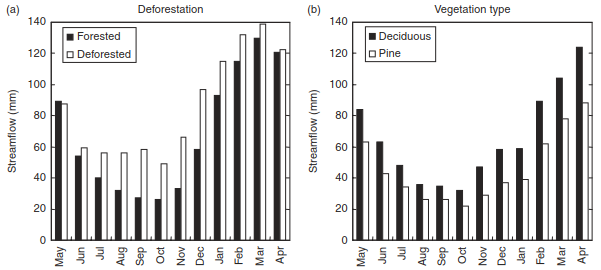
Fig. 11.4. Hydrologic response of (a) Coweeta watershed 17 to clearcutting and (b) Coweeta watershed 1 to conversion from deciduous trees to evergreen white pine. data for watershed 17 are shown for the period before cutting (forested) and for a 7-year period after cutting (deforested). data for watershed 1 are shown for mature deciduous forest and a 4-year period after planting pine. adapted from Swank et al. (1988)
The type of vegetation also influences runoff. Conversion of Coweeta watersheds from mature deciduous forest to young white pine trees reduced annual streamflow by 20 cm (20%) below that of deciduous forest (Swank and Miner 1968; Swank and Douglass 1974). This was a result of greater interception and subsequent evapotranspiration of rainfall by evergreen pines than deciduous trees during the dormant season. The reduction in streamflow occurred every month and was greatest before and during leaf emergence (March, April, May) (Figure 11.4b).
Date added: 2026-09-24; views: 1;