
Environmental Controls of Forest Net Primary Production
Introduction to Environmental Controls on Net Primary Production. Stand age, species composition, and site conditions—such as temperature, soil moisture, and nutrient availability—exert profound controls on ecosystem net primary production (NPP). On a local scale, topographies such as elevation and slope strongly alter temperature and moisture gradients, thereby dictating tree growth dynamics. Generally, annual tree productivity demonstrates a inverse relationship with elevation due to cooler thermal regimes.
Artificial resource manipulation experiments routinely confirm the key role of water and nutrient supply in driving primary productivity. In a foundational study on a 50-year-old Douglas fir (Pseudotsuga menziesii) stand in the Rocky Mountains of New Mexico, researchers conducted two-year treatments consisting of weekly irrigation (effectively doubling natural precipitation) or a single spring fertilization with nitrogen and essential nutrients (Gower et al., 1992). Pretreatment baseline measurements in untreated control plots ensured accurate experimental control.
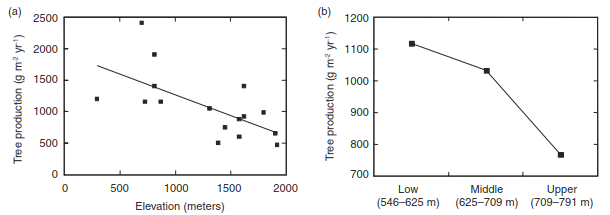
Fig. 20.6. Aboveground tree production in relation to elevation for (a) the Great Smoky Mountains circa mid-1960s and (b) the Hubbard Brook Experimental Forest circa 1956–65. Data from Whittaker (1966) and Whittaker et al. (1974).
Experimental Manipulations: Irrigation and Fertilization Dynamics. Over the two-year study period, aboveground net primary production (ANPP) in the untreated control plots increased by 13% relative to pretreatment values. However, supplemental water and nutrient applications yielded significantly higher productivity gains. ANPP expanded by 57% in irrigated plots and 70% in fertilized plots compared to baseline values, with the primary sink for this newly assimilated carbon being foliage biomass.
Simultaneously, carbon allocation shifting occurred belowground. The proportion of total NPP directed to root systems decreased markedly from 46% in untreated control environments to 31% in irrigated plots and 23% under fertilization regimes. This shift demonstrates plants' plastic allocation response, prioritizing aboveground light capture when soil resources are abundant.
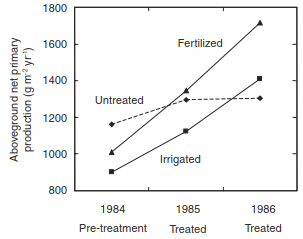
Fig. 20.7. Effect of fertilizer and irrigation on aboveground net primary production of Douglas fir over three years. Data from Gower et al. (1992).
Stand Structure, Leaf Area Index, and Age-Dependent Productivity Decline. Forest stand architecture governs light interception and overall net primary productivity. Carbon uptake via gross primary production (GPP) scales with increases in the leaf area index (LAI). However, light absorption saturates at high LAI thresholds, causing GPP to plateau.
Forest ecosystems typically achieve peak productivity early in stand development, followed by an age-dependent decline following canopy closure (He et al., 2012; Fahey et al., 2005). Studies on commercial slash pine (Pinus elliottii) plantations in Florida illustrate this structural progression (Gholz and Fisher, 1982). Peak LAI is attained around 14 years post-clearcutting, whereas ANPP reaches its maximum at 26 years before steadily declining.
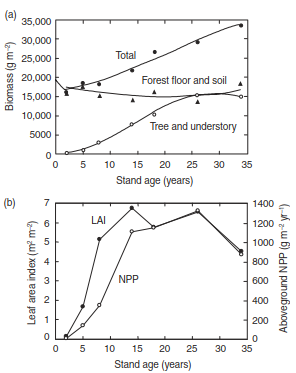
Fig. 20.8. Development following clear-cutting of commercial slash pine plantations near Gainesville, Florida. (a) Accumulation of biomass in vegetation, forest floor, and soil. (b) Aboveground net primary production (NPP) and leaf area index (LAI) for the tree stratum. Adapted from Gholz and Fisher (1982).
This pattern of age-related decline is widespread across diverse forest biomes. Mechanisms driving this reduction include increased autotrophic respiration costs associated with expanding woody biomass accumulation and reduced photosynthetic capacity in older foliage (Ryan et al., 1997, 2004).
Species Composition and Carbon Allocation in Boreal and Temperate Ecosystems. Variations in site conditions, species traits, and canopy structure drive substantial differences in GPP, respiration, and carbon partitioning between aboveground and belowground organs. In central Saskatchewan boreal forests, total NPP ranges from 222 to 392 g C m⁻² yr⁻¹ (Gower et al., 1997; Steele et al., 1997). Quaking aspen (Populus tremuloides) stands exhibit significantly higher total production than black spruce (Picea mariana) or jack pine (Pinus banksiana).
Furthermore, aspen stands allocate only 10% of total NPP to belowground root networks, compared to 42% in black spruce and 47% in jack pine. Consequently, aspen achieves an ANPP of 352 g C m⁻² yr⁻—two to three times greater than that of adjacent needleleaf conifer stands. High root carbon allocation by needleleaf evergreens relative to broadleaf deciduous species represents a consistent ecological trend across the boreal zone.
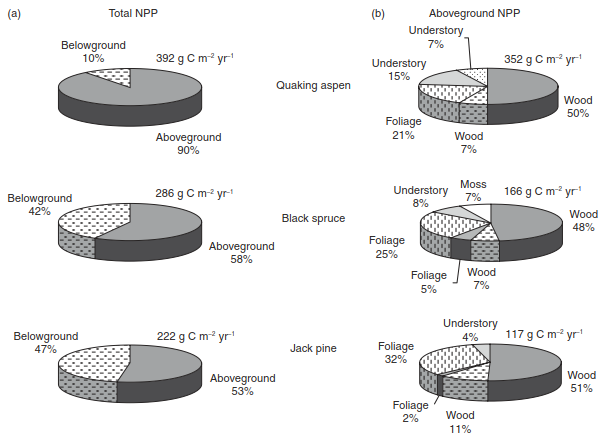
Fig. 20.9. Annual productivity for quaking aspen, black spruce, and jack pine forests in central Saskatchewan. (a) Net primary production and its allocation into aboveground and belowground production. (b) Aboveground net primary production and its allocation into biomass increment (shaded) and litterfall (dashed). Data from Gower et al. (1997) and Steele et al. (1997).
Macroclimatic Gradients and Regional Carbon Dynamics. Environmental controls on carbon allocation are clearly evident along steep climatic gradients. A 225 km transect across Oregon—extending from the Pacific Coast through the Coast Range and Cascade Mountains to the arid eastern interior—demonstrates the influence of precipitation and thermal regimes (Runyon et al., 1994; Williams et al., 1997). Across this gradient, elevation spans 170 to 1460 m, mean annual temperature ranges from 6.0 to 11.2 °C, and annual precipitation drops from 2510 mm in the west to 220 mm in the east.
Coastal maritime forests dominated by Sitka spruce (Picea sitchensis) and western hemlock (Tsuga heterophylla) exhibit dense canopies (LAI up to 8.6 m² m⁻²) and high productivity. Moving inland past the Cascade crest, rain-shadow conditions create subalpine mountain hemlock (Tsuga mertensiana), ponderosa pine (Pinus ponderosa), and western juniper (Juniperus occidentalis) woodlands characterized by open canopies (LAI down to 0.4 m² m⁻²). Total NPP along the transect ranges from 302 to 2404 g C m⁻² yr⁻¹, with harsh alpine and arid sites shifting carbon partitioning heavily toward belowground root structures.
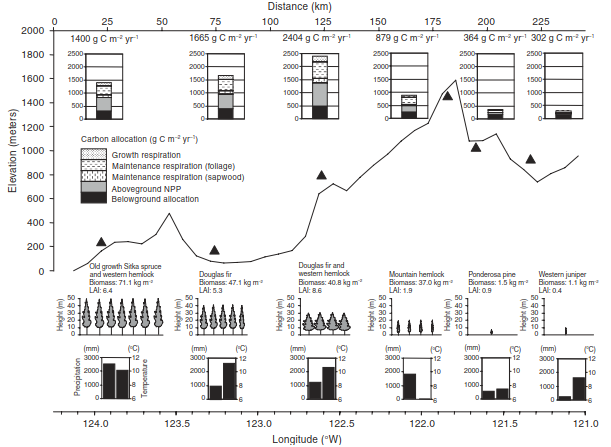
Fig. 20.10. Climate, stand structure, and carbon allocation for six forests along a west-to-east transect in Oregon between latitudes 44°N and 45°N beginning at the coast and extending 225 km inland. The elevation profile is the approximate elevation based on a 5-minute dataset at latitude 44°33.25′ N. Carbon allocation sums to gross primary production, given at the top of each bar chart. Data from Runyon et al. (1994) and Williams et al. (1997).
Detritus Dynamics, Litterfall, and Nutrient Pools. Not all fixed carbon is sequestered into persistent woody biomass increment; substantial portions enter detrital pathways as foliage, twig, branch, and root litter. Fine root turnover represents a major input of organic carbon to the soil matrix. In boreal forests, detritus production accounts for 32% to 43% of total ANPP. Deciduous species lose leaf biomass via autumn abscission, whereas evergreen conifers shed needles gradually over several years depending on needle longevity.
Coarse woody debris (CWD)—comprising standing dead snags, downed boles, and large branches—is produced via windthrow, fire, insect outbreaks, disease, and natural suppression. In Saskatchewan boreal forests, annual CWD production represents 7% to 11% of ANPP (12–25 g C m⁻² yr⁻¹). Because woody boles decay slowly, accumulated CWD stocks reach 1–4 kg m⁻² in deciduous forests and 10–51 kg m⁻² in coniferous ecosystems (Harmon et al., 1986).
Nutrient pools within these forest ecosystems are partitioned among aboveground biomass, belowground biomass, and the forest floor organic layer. Data from a 55-year-old northern hardwood forest at the Hubbard Brook Experimental Forest (Likens et al., 1977) illustrates these standing nutrient stocks:

Table 20.1. Standing stocks of nutrients in a 55-year-old northern hardwood forest in the Hubbard Brook Experimental Forest. Note: All nutrient values expressed in g m⁻². Source: From Likens et al. (1977, p. 101).
Date added: 2026-09-24; views: 1;