
Ecosystem Ecology: Structure, Function, and Forest Dynamics
Structural and Functional Foundations of Terrestrial Ecosystems. A terrestrial ecosystem combines living organisms (plants, animals, and microorganisms) and their non-living physical environment into a unified, functional system linked through dynamic biological, chemical, and physical processes. The soil matrix provides crucial water, nutrients, and physical anchorage required for plant growth and survival. The availability of these resources is continually modulated by biological activity from plant roots and soil microflora.
The concept of an ecosystem embodies the complex interrelationships between abiotic factors and living organisms:
- Ecosystem Structure: Quantified by total material pools—such as carbon (C) and nitrogen (N)—and their spatial and biological distribution among living tissues, organic debris, and inorganic soil matrices.
- Ecosystem Functioning: Measured by operational process rates, including photosynthesis, autotrophic and heterotrophic respiration, evapotranspiration, and biogeochemical elemental cycling.
Plant productivity and soil nutrient cycling exist in a tightly coupled positive feedback loop. High soil nutrient availability enhances plant nutrient uptake during vegetative growth, elevating net primary production (NPP) and generating substantial, nutrient-rich litterfall. High-quality plant litter decomposes rapidly through microbial mineralization, releasing inorganic nutrients back to the soil matrix and reinforcing the state of high nutrient availability. Conversely, low nutrient conditions produce recalcitrant litter, slowing decomposition rates and reducing nutrient return. Manipulation experiments testing responses to atmospheric CO₂ enrichment, artificial warming, and nitrogen deposition provide deep insight into how these feedback loops dictate ecosystem stability under global change.
Historical Paradigm Shifts in Ecosystem Ecology. The scientific debate regarding the true nature of plant communities directly catalyzed the emergence of ecosystem ecology as a distinct discipline. Tansley (1935) first coined the term ecosystem, though formal operational frameworks required decades of refinement (McIntosh 1985; Golley 1993).
Two historical paradigms competed to define ecosystem organization:
- Superorganism Paradigm (Clementsian View): Asserted that ecosystems represent integrated biological entities with emergent properties analogous to complex organisms (Clements 1916, 1928; Odum 1953, 1969, 1971).
- Individualistic Paradigm (Gleasonian View): Positioned ecosystems as continuous, open assemblages of individual organisms interacting with one another and their physical environment (Gleason 1917, 1926, 1939).
Over time, ecosystem science organized around tracking the circulation of energy, carbon, and essential nutrients (Lindeman 1942; Odum 1953; Bormann and Likens 1967; Likens et al. 1977). Modern ecosystem ecology views these material fluxes as the binding mechanism linking biotic communities to abiotic environments across variable spatial scales.
Spatial boundaries vary depending on the research scope: global planetary boundaries integrate the biosphere, hydrosphere, atmosphere, pedosphere, and lithosphere; micro-ecosystems encompass localized structures such as decomposing forest logs; and watershed or stand-level studies (typically 5–10 ha, where 1 ha = 10,000 m²) enable precise mass-balance measurements of hydrological and nutrient export via streamflow.
Empirical Case Study: The Hubbard Brook Ecosystem Study. Long-term research at the Hubbard Brook Experimental Forest in central New Hampshire demonstrates how population, community, and ecosystem dynamics intersect within a northern hardwood forest ecosystem (Likens et al. 1977, 1994, 1998; Bormann and Likens 1979; Likens and Bormann 1995; Likens 2004; Fahey et al. 2005). Located across a 13.23 ha watershed ranging in elevation from 546 m to 791 m, the site features steep, southeast-facing slopes (21–23%) on predominantly sandy loam soils under a cool, humid continental climate.
Forest Stand Composition and Population Structure. Following historic logging operations between 1909 and 1917, long-term surveys conducted in the 1950s and 1960s evaluated forest stand composition for trees with a diameter at breast height (DBH) greater than 10 cm (Figure 20.1a):
The population size structure revealed an all-aged forest undergoing active succession (Figure 20.1b). Large trees were sparse survivors from pre-logging conditions, moderate-sized trees (11–20 cm DBH) represented post-logging regeneration, and high seedling densities provided ongoing replacement. Species distributions varied systematically across the elevational gradient (Figure 20.1c): sugar maple, beech, and yellow birch dominated all elevations, whereas paper birch, red spruce, and balsam fir expanded significantly on upper slopes.
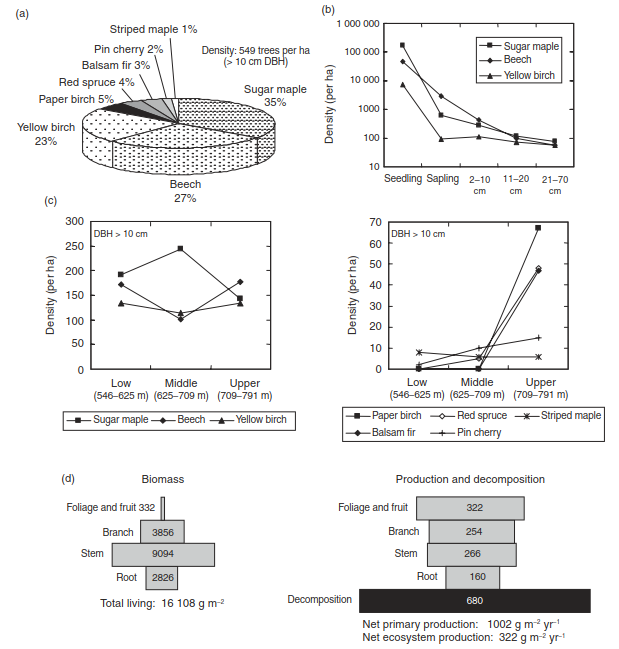
Figure 20.1. Population structure, community composition, and ecosystem structure and function in a small watershed of the Hubbard Brook Experimental Forest circa 1956–1965. (a) Community composition in terms of the abundance of trees with a diameter at breast height (DBH) greater than 10 cm. (b) Size structure of sugar maple, beech, and yellow birch populations. Size classes are seedlings, saplings, and trees with DBH of 2–10 cm, 11–20 cm, and 21–70 cm. (c) Population density with respect to elevation (lower, middle, and upper third of slopes). Graphs show the density of trees with DBH > 10 cm for sugar maple, beech, and yellow birch (left panel) and other species (right panel). (d) Biomass distribution for foliage and fruit, branches, stems, and roots. The figure on the left shows biomass (g m⁻²). The figure on the right shows net primary production and decomposition (g m⁻² yr⁻¹). Boxes are proportional in size to pools and fluxes. Data from Bormann et al. (1970) and Whittaker et al. (1974). See Fahey et al. (2005) for updated carbon pools and fluxes.
Forest Carbon Budget and Long-Term Ecosystem Mass Balance. Initial ecological evaluations in the 1950s and 1960s quantified total living plant biomass at 16,108 g m⁻² dry weight (Figure 20.1d). Carbon accounts for approximately 45% of total dry organic biomass; fresh biomass contains up to 80–90% water. Aboveground plant organs contained 82% of total biomass, leaving 18% belowground in root systems.
Annual net primary production (NPP) reached 1002 g m⁻² yr⁻¹ (representing an atmospheric uptake of 451 g C m⁻² yr⁻¹). Litterfall decomposition returned 680 g m⁻² yr⁻¹ of organic material to the soil, releasing 306 g C m⁻² yr⁻¹ back to the atmosphere.
Net Ecosystem Production (NEP) = NPP – Decomposition
NEP = 1002 g m⁻² yr⁻¹ − 680 g m⁻² yr⁻¹ = 322 g m⁻² yr⁻¹ (145 g C m⁻² yr⁻¹)
This positive net balance demonstrates that the maturing secondary forest acted as a continuous carbon sink, sequestering 145 g C m⁻² yr⁻¹ into growing aggrading biomass pools.
Follow-up ecological surveys conducted in the late 1990s (Fahey et al. 2005) demonstrated substantial long-term ecosystem maturation. Total tree biomass expanded to 26,680 g m⁻², representing a 66% increase compared to the mid-century measurements. The organic forest floor pool reached 6600 g m⁻². As the forest approached a late-successional quasi-steady state, aboveground net primary production slowed, registering a 24% decline relative to the rapid growth phase documented during earlier decades.
Date added: 2026-09-24; views: 1;