
Anthropogenic Land Cover Change and Regional Climate Dynamics in Australia
Historical land cover transformation in Australia. Australia has experienced extensive changes in land cover driven by anthropogenic activities (McAlpine et al. 2009). Extensive grazing covers approximately 43 percent of the continent, with intensive cropping and improved pastures covering another 10 percent. A substantial portion of this land conversion occurred in the southwest and southeast regions, where 50 percent of native forests and 65 percent of native woodlands have been cleared or severely modified.
The Murray–Darling basin, spanning over 1 million km² in southeastern Australia, serves as a prime geographic region demonstrating this landscape transformation (Figure 28.7). Since European settlement in the early 1800s, the basin underwent extensive clearing of native woodland and forest to establish livestock grazing and agricultural croplands. By the 1980s, forests, woodland, and mallee vegetation were reduced in land area by 64 percent, 63 percent, and 34 percent, respectively. Concurrently, selective tree thinning for grazing operations increased the overall surface area of open woodlands by 127 percent.
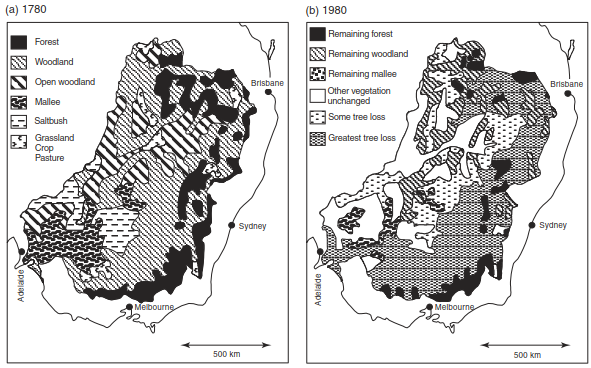
Fig. 28.7. Vegetation of the Murray–Darling Basin in southeastern Australia (a) prior to European settlement circa 1780 and (b) circa 1980. Adapted from Walker et al. (1993).
Regional climate modeling of post-European land conversion. Narisma and Pitman (2003) utilized a regional climate model to investigate the thermodynamic and hydrological effects of land-cover change across Australia. Comparing vegetation distribution from 1788 (when Europeans first arrived) to 1988 revealed widespread replacement of native trees by herbaceous grasses in the southwestern portion of Western Australia and across southeastern regions spanning New South Wales, Victoria, and South Australia (Figure 28.8). Conversely, shrublands encroached into formerly sparsely vegetated areas in Queensland in the northeast.
The conversion from tree-dominated canopies to grassland ecosystems systematically increases surface albedo, decreases leaf area index (LAI), and decreases surface roughness length. When climate simulations were conducted using 1788 and 1988 vegetation distributions as surface boundary conditions, notable shifts in surface energy partitioning emerged.
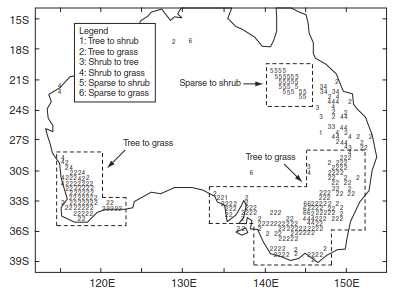
Fig. 28.8. Land-cover change in Australia (1788–1988) as represented in a climate model. Numbers denote the type of change. Land cover is unchanged in areas without numbers. Adapted from Narisma and Pitman (2003).
Biogeophysical climate impacts across Australian regions. The largest shift in simulated climate occurs in January during the Australian summer, directly resulting from the repartitioning of net radiation into sensible and latent heat fluxes (Figure 28.9). Net radiation changes by less than ±20 W m⁻² under the 1988 vegetation regime. However, latent heat flux decreases by more than 40 W m⁻² across expansive regions where agricultural grasses replaced native tree species. Conversely, localized increases in latent heat flux occur in areas undergoing shrub encroachment, driven primarily by higher leaf area index and aerodynamic roughness length.
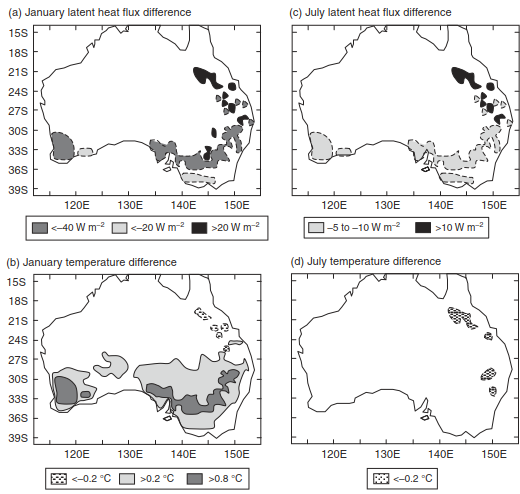
Fig. 28.9. Effect of land-cover change in Australia on latent heat flux and air temperature for (a, b) January and (c, d) July. Adapted from Narisma and Pitman (2003).
· 1st spatial effect: Widespread summer (January) warming of 1.0–1.5 °C occurs in southwestern and southeastern Australia due to suppressed latent heat flux and elevated sensible heat flux.
· 2nd spatial effect: Air temperatures in northeastern Australia decrease by approximately 0.2 °C in January and 0.5 °C in July, resulting from enhanced latent heat flux and decreased sensible heat flux.
· 3rd spatial effect: Mean precipitation averaged across the three primary regions of land-cover change exhibits an overall reduction.
Complementary climate modeling studies similarly confirm summer surface warming across southeastern Australia alongside reduced summer rainfall (McAlpine et al. 2007), demonstrating that anthropogenic land-cover change has exacerbated the severity and duration of regional drought events (Deo et al. 2009).
Mechanisms driving precipitation shifts in southwestern Australia. Regional climate modeling highlights that historical land cover change contributed to precipitation reductions in parts of Australia (Narisma and Pitman 2003). A critical area affected by this dynamic is southwestern Western Australia, a Mediterranean climate zone characterized by winter-dominant rainfall that has experienced decline since the mid-1900s alongside extensive deforestation for agricultural expansion.
Pitman et al. (2004) evaluated land-cover impacts on regional precipitation using three distinct regional climate models. Across all three model frameworks, historical land-cover change caused a 10–20 percent reduction in July rainfall along coastal zones and a corresponding 10–20 percent increase further inland, matching empirical observations.
· 1st physical mechanism: Deforestation reduces aerodynamic surface roughness length across cleared coastal landscapes.
· 2nd physical mechanism: Reduced roughness alters the onshore advection of marine moisture and reshapes spatial patterns of moisture convergence and divergence.
· 3rd physical mechanism: Shifts in atmospheric moisture divergence reduce coastal precipitation while enhancing moisture transport further inland.
These numerical findings demonstrate that historical land clearing directly contributed to the observed long-term drying trend in southwestern Western Australia (Timbal and Arblaster 2006; Nair et al. 2011).
Deep-time human landscape impacts and monsoonal sensitivity. Anthropogenic manipulation of the Australian landscape extends into deep history, dating back to initial human arrival approximately 45,000–50,000 years before present (Miller et al. 2005a; Bird et al. 2013). Early human populations utilized fire for landscape burning during hunting and land management. Shifts in historical fire regimes transformed native vegetation from a mosaic of drought-adapted trees and shrubs mixed with grasses into the modern landscape dominated by fire-adapted desert scrubland and grassland.
Contemporary summer precipitation is high along the northern Australian coast and decreases sharply toward the continental interior (Figure 5.12). Climate model simulations indicate that the inland penetration of the summer monsoon is sensitive to vegetation structure (Miller et al. 2005b). Dense vegetation featuring high leaf area enhances the interior penetration of monsoonal rainfall, whereas conversion to modern desert scrub suppresses inland moisture transport. However, alternative modeling evaluations suggest that reduced vegetation cover exerts minimal impact on overall monsoon strength (Marshall and Lynch 2008) or delays monsoonal onset and reduces early-season rainfall while leaving peak monsoonal precipitation largely unaffected (Notaro et al. 2011).
Climate Impacts of Tropical Deforestation: Modeling & Observations
Tropical Deforestation and Regional Climate Dynamics. The impact of tropical deforestation on climate has long held the interest of climate modelers. One of the first such studies was that of Henderson-Sellers and Gornitz (1984). They used a global climate model to study the effect of replacing Amazonian rainforest with pasture by changing surface albedo, roughness length, and soil water-holding capacity. These surface changes decreased evapotranspiration and rainfall. A subsequent study by Dickinson and Henderson-Sellers (1988) used a global climate model that included a second-generation land surface model, the Biosphere-Atmosphere Transfer Scheme (BATS). All model grid cells located in South America and classified as evergreen broadleaf tree were changed to degraded grassland (Figure 28.10a). This change in vegetation decreased roughness length, leaf area index (LAI), and vegetated fraction, and altered stomatal conductance. Soil texture was also changed to finer soil with more clay to reduce water-holding capacity, and soil color was made lighter to increase soil albedo.
Simulated Amazonian Deforestation Response. The most prominent climate signal from these simulations is a warming of temperature by 1–4 °C and a decrease in evapotranspiration throughout the Amazon basin (Figure 28.10b). Precipitation decreases in the western Amazon, but increases in the eastern basin.
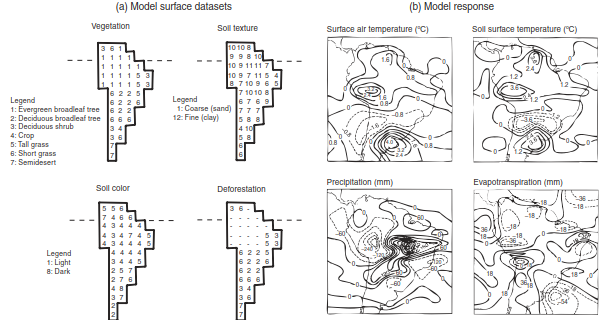
Fig. 28.10. Effect of Amazonian deforestation on simulated climate. (a) Vegetation, soil texture, and soil color in the control simulation. In the deforestation simulation, evergreen broadleaf tree was changed to degraded pasture. (b) Difference in January surface climate between the deforested and control simulations. The climate model has a spatial resolution of 4.5° latitude and 7.5° longitude. Adapted from Dickinson and Henderson-Sellers (1988).
Modeling Studies on Amazonian Land Surface Changes. Numerous climate model studies have since examined the impact of tropical deforestation on climate. Most studies of Amazonian deforestation find that complete transformation of forest to pasture results in a warmer and drier climate (Table 28.9). Fifteen of 18 studies report an increase in annual mean air temperature ranging from 0.3 °C to 3.8 °C (mean, 1.7 °C). Sixteen of 18 studies show decreased annual precipitation ranging from -146 to -643 mm (mean, -398 mm), and all studies find decreased evapotranspiration. Evapotranspiration decreases because of lower surface roughness, because trees have deep roots that sustain transpiration during the dry season, because interception loss decreases, and because higher surface albedo decreases net radiation. A warmer, drier climate upon deforestation is found throughout the tropics, though the magnitude varies with region (Delire et al. 2001; Snyder et al. 2004; Voldoire and Royer 2004; Hasler et al. 2009; Lawrence and Vandecar 2015). Some studies suggest that tropical deforestation can affect extratropical climate through atmospheric teleconnections (Werth and Avissar 2002; Snyder 2010; Medvigy et al. 2013).
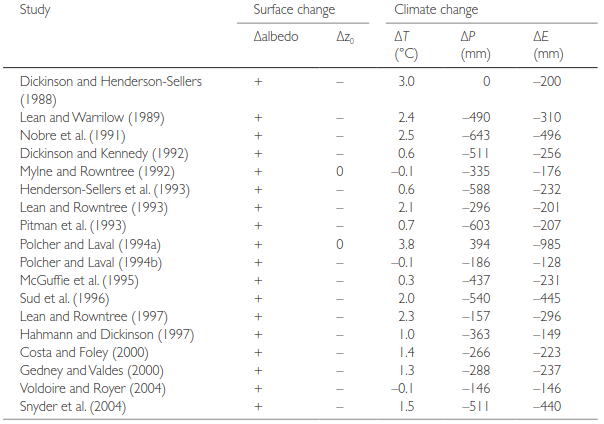
Table 28.9. Annual response to Amazonian deforestation in various climate model studies. Note: Δalbedo and Δz₀ denote the change in surface albedo and roughness (+, increase; -, decrease; 0, no change). ΔT, ΔP, and ΔE are the simulated changes in annual temperature, precipitation, and evapotranspiration, respectively. Lawrence and Vandecar (2015) review tropical deforestation climate model simulations.
Deforestation Scales and Mesoscale Atmospheric Effects. A key question with tropical deforestation is whether precipitation does decrease with deforestation, as the models predict. The type of land cover conversion (replacement by pasture or by cropland) affects the simulated reduction in precipitation (Costa et al. 2007). The effects of tropical deforestation may be more complex than represented in large-scale, global climate models (Pielke et al. 2007). The decrease in annual precipitation in the Amazon in response to total deforestation may be smaller in high resolution models (e.g., -62 mm yr⁻¹; Medvigy et al. 2011). Moreover, climate model studies of Amazonian deforestation are idealized and completely deforest the entire basin. In fact, however, deforestation is localized and patchy, and there may be a critical threshold before precipitation decreases (Lawrence and Vandecar 2015). Small-scale, heterogeneous deforestation affects atmospheric processes at the mesoscale, in some cases even enhancing convection (Avissar et al. 2002; Baidya Roy and Avissar 2002; Weaver et al. 2002; Ramos da Silva and Avissar 2006; Khanna and Medvigy 2014). Deforestation produces a detectable effect on clouds in the region. Shallow clouds develop preferentially over deforested areas (Wang et al. 2009). This relates to a more unstable atmospheric boundary layer over forests that has high humidity and also to mesoscale circulations created by the contrast between interspersed patches of forests and deforested land. Direct observational evidence for precipitation changes is lacking. However, moisture budget analyses show that air that passes over tropical forests produces more rainfall than air that moves over sparse vegetation (Spracklen et al. 2012).
Observational and Micrometeorological Insights from Field Campaigns. Numerous observational field campaigns have been conducted in the Amazon to infer the realism of climate model simulations (Nobre et al. 2004). Data collected during the Anglo-Brazilian Amazonian Climate Observation Study (ABRACOS; Gash et al. 1996; Gash and Nobre 1997) contrast the micrometeorology of nearby forest and pasture sites in Amazonia and illustrate the effects of deforestation (Figure 28.11).
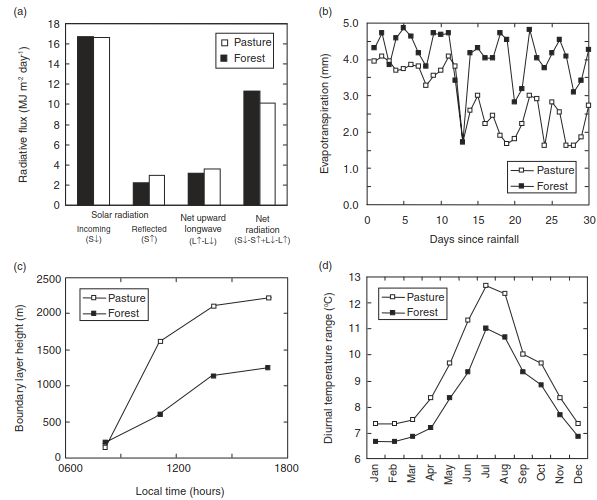
Fig. 28.11. Micrometeorology of pastures and forests in the Brazilian Amazon. (a) Daily radiative fluxes (Culf et al. 1996). (b) Daily evapotranspiration during the dry season over 30 days following heavy rainfall (Wright et al. 1992). (c) Height of the convective boundary layer (Gash and Nobre 1997). (d) Mean monthly diurnal temperature range (Culf et al. 1996).
Radiation and Energy Balance Shifts. One difference is the radiation balance (Culf et al. 1996). During the study, forest and pasture received similar solar radiation, but the pasture had a higher albedo than the forest (0.18 versus 0.13). In addition, the pasture was warmer than the forest and emitted more longwave radiation. As a result, the net radiation balance for the pasture was 11 percent less than for the forest. Pastures are also shorter than forests and have lower aerodynamic roughness. During the wet season, pasture evapotranspiration is typically less than that of forest due to the reduced available energy and reduced roughness.
Dry-Season Evapotranspiration and Boundary Layer Dynamics. During the dry season, shallow-rooted pastures tend to have low evapotranspiration because the surface soil water is depleted. In contrast, forests have no significant reduction in evapotranspiration because the deep-rooted trees extract water from deep in the soil. This is particularly evident following heavy rain. Wright et al. (1992) found that for the first 10 days or so following heavy rainfall, pasture and forest had sustained evapotranspiration (Figure 28.11b). Thereafter, pasture evapotranspiration declined as the upper soil dried. In contrast, the forest had relatively constant evapotranspiration throughout the measurement period. Reduced evapotranspiration from pasture affects the atmospheric boundary layer. Gash and Nobre (1997) reported that the convective boundary layer over pasture was 700–1000 m higher than over forest because of stronger sensible heating (Figure 28.11c). The net result of these differences in radiation and evapotranspiration is that pastures are warmer during the day than forests (Culf et al. 1996). This is seen in the diurnal temperature range, which for the particular sites studied was larger for the pasture than for the forest, especially during the June–August dry season (Figure 28.11d).
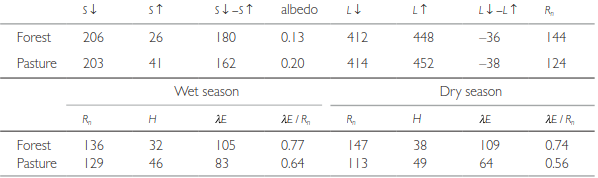
Table 28.10. Energy fluxes (W m⁻²) and surface albedo (fraction) for forest and pasture in Rondônia, Brazil. Season-Specific Partitioning in Rondônia. Note: S↓, incoming solar radiation. S↑, reflected solar radiation. L↓, incoming longwave radiation. L↑, outgoing longwave radiation. Rₙ, net radiation. H, sensible heat flux. λE, latent heat flux. λE / Rₙ, evaporative fraction. Source: From von Randow et al. (2004).
LBA Findings and Flux Measurements. Similar results are seen in the Large-Scale Biosphere-Atmosphere Experiment in Amazonia (LBA). von Randow et al. (2004) contrasted energy fluxes measured in forest and pasture (Table 28.10). Averaged over the measurement period, pasture had a higher albedo than forest (0.20 versus 0.13). The pasture also lost more longwave radiation than the forest so that net radiation was 14 percent lower compared with forest. At both sites, latent heat flux was the dominant turbulent flux in the wet and dry seasons. The forest had greater latent heat flux and lower sensible heat flux than did the pasture. Whereas high latent heat flux was sustained at the forest during the dry season, latent heat flux decreased at the pasture during the dry season. da Rocha et al. (2004) also found sustained latent heat flux year-round at a forest in eastern Amazonia (Table 28.11). The Bowen ratio, evaporative fraction, and surface conductance showed little sign of significant soil water stress during the dry season. Similar to earlier field programs, LBA studies show high sensible heat fluxes over pasture during the dry season create a boundary layer that is several hundred meters deeper, has warmer temperature, and has decreased moisture compared with that found over forest (Fisch et al. 2004). Both types of vegetation have similar boundary layer depth, temperature, and humidity during the wet season.
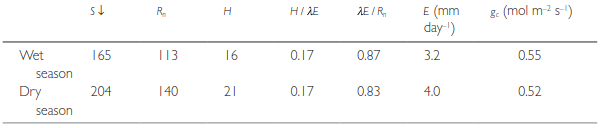
Table 28.11. Energy fluxes (W m⁻²) for forest in eastern Amazonia (3.0°S, 54.6°W). Note: S↓, incoming solar radiation. Rₙ, net radiation. H, sensible heat flux. λE, latent heat flux. H / λE, Bowen ratio. λE / Rₙ, evaporative fraction. E, evapotranspiration. g_c, surface conductance and converted to mol m⁻² s⁻¹ using ρ_m = 42.3 mol m⁻³. Source: From da Rocha et al. (2004).
Rooting Depth Mechanics and Large-Scale Circulation. Soil water availability for transpiration is a key control of tropical climate. Flux tower measurements reveal the importance of deep roots to sustain transpiration by trees. Studies have documented the sensitivity of climate to rooting depth (Nepstad et al. 1994; Kleidon and Heimann 2000). Deep roots sustain transpiration during the dry season, leading to a cooler, moister climate. Sustained evapotranspiration during the dry season can alter tropical atmospheric circulation and precipitation.
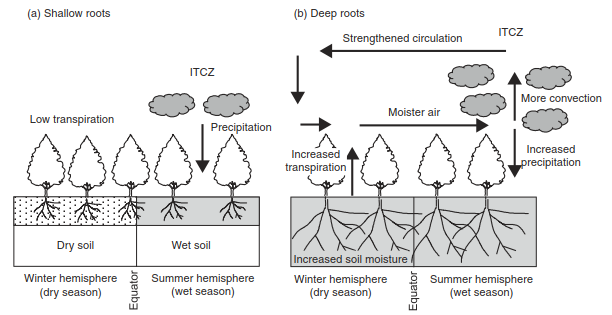
Fig. 28.12. Changes in tropical circulation and precipitation across the equator as a result of (a) shallow-rooted trees and (b) deep-rooted trees. Shaded areas denote soil water. Adapted from Kleidon and Heimann (2000).
Transpiration and Intertropical Convergence. Without deep roots, tropical vegetation in the winter hemisphere, which is experiencing a dry season, becomes water-stressed and has low transpiration. Increased transpiration as a result of deep roots increases moisture transport toward the Intertropical Convergence Zone (ITCZ) (Figure 28.12). More energy is available in the form of latent heat, which enhances convection and cloud cover in the summer hemisphere. An additional factor may be nocturnal redistribution of soil water during the dry season that recharges the upper soil with water from deeper in the soil profile (da Rocha et al. 2004). Such redistribution increases soil water availability and sustains evapotranspiration (Lee et al. 2005; Wang 2011).
- 1st mechanism: Deep roots sustain transpiration in the winter hemisphere dry season, maintaining higher atmospheric moisture transport toward the ITCZ.
- 2nd mechanism: Enhanced latent heat flux from deep-rooted vegetation fuels stronger convective overturning and cloud formation in the summer hemisphere.
- 3rd mechanism: Hydraulic redistribution recharges upper soil layers overnight, providing a continuous moisture source to support daytime evapotranspiration.
Date added: 2026-09-24; views: 3;