
Land Degradation and Climate Feedbacks in Arid and Semiarid Lands
Land degradation dynamics in dryland ecosystems. In arid and semiarid climates, overgrazing by livestock, fuelwood collection, and other anthropogenic activities can lead to land degradation that reduces vegetation cover, increases bare soil, decreases soil resources (water-holding capacity and nutrients), and increases soil salinity (Reynolds et al. 2007; D’Odorico et al. 2013). These comprehensive environmental alterations are encompassed within the broader concept of desertification. A critical dimension of desertification involves local and regional climate shifts directly induced by terrestrial degradation.
Microclimatic impacts along the US–Mexico border. The landscape along the United States–Mexico border in the Sonoran Desert serves as a classic empirical case study regarding the climate effects of overgrazing (Balling 1988, 1989; Bryant et al. 1990; Balling et al. 1998). A sharp contrast in vegetation cover spans several hundred kilometers along the geopolitical border line. On the Mexican side, intensive overgrazing has significantly shortened grass cover and exposed bare soil, elevating the surface albedo relative to southern Arizona, which maintains denser grass cover.
Long-term meteorological records reveal that summer daily maximum air temperatures on the Mexican side of the border are 4 °C warmer than nearby locations in Arizona after correcting for elevation differences (Balling 1988). Furthermore, observational data from 1969 to 1983 indicated that surface temperatures in Sonora warmed at a significantly faster rate than stations across the border in Arizona (Balling et al. 1998).
· 1st mechanism: The Mexico–United States temperature contrast intensifies with higher rainfall throughout the summer season (Balling 1989).
· 2nd mechanism: Wet summers support dense, productive vegetation with high evapotranspiration rates in Arizona, inducing evaporative cooling.
· 3rd mechanism: Severe overgrazing in Mexico severely restricts vegetation cover, suppressing latent heat flux and raising daytime air temperatures.
Although higher albedo on overgrazed land reflects more solar radiation (which theoretically acts to cool the surface), the reduction in vegetation cover suppresses evapotranspiration to such a degree that net surface heating dominates.
Fig. 28.2. Annual mean change in temperature zonally averaged over deforested areas. (a) Net effect. (b) Individual effects of changes in surface albedo, surface roughness, and evapotranspiration efficiency. Adapted from Davin and de Noblet-Ducoudré (2010).
This thermodynamic contrast is reflected in measured surface energy fluxes across the border interface.
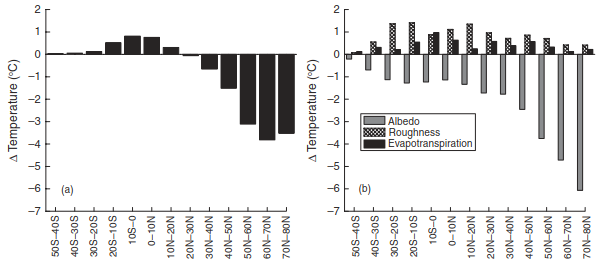
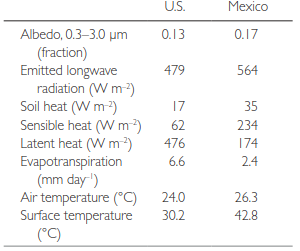
Table 28.4 Energy budget along the United States–Mexico border measured at 1100 local time on September 22, 1987 after 15 days without rain. Source: From Bryant et al. (1990).
During the measurement period following 15 days without rain, the site in Mexico exhibited a higher albedo (0.17) than the US site (0.13). Latent heat flux was nearly three times greater on the US side. The lower latent heat in Mexico was offset by a markedly higher sensible heat flux (yielding a Bowen ratio of 1.3 in Mexico compared to 0.13 in the US) and greater soil heat flux, which significantly warmed both the ground surface and lower atmospheric layer.
Woody encroachment and thermal regime alteration. Beyond desertification, other dryland regions are undergoing woody encroachment, where shrubs and trees invade native grasslands and savannas (D’Odorico et al. 2013). In the southern Great Plains of North America, woody encroachment alters regional energy partitioning (Ge and Zou 2013). Model simulations demonstrate that shrub expansion decreases surface albedo, increases leaf area index (LAI), and increases surface roughness relative to native shortgrasses.
· 1st effect: Lower surface albedo increases net absorbed solar radiation.
· 2nd effect: In arid regimes, additional absorbed energy is dissipated primarily as sensible heat rather than latent heat due to limited soil moisture.
· 3rd effect: Surface warming driven by reduced albedo outweighs any enhanced evaporative cooling, increasing daily maximum air temperatures by up to 0.6 °C where shrubs completely replace shortgrasses.
· 4th effect: Daily minimum temperatures decrease slightly (0.1–0.2 °C).
Similarly, in the northern Chihuahuan Desert, shrub encroachment elevates nighttime winter temperatures above shrublands compared to grasslands (He et al. 2010, 2011). The lower vegetation fraction of shrublands allows more energy to enter the soil during daytime hours, which is subsequently released at night as longwave radiation.
Afforestation and surface energy balance in Israel. Field studies in the Negev region of southern Israel and adjacent areas highlight the profound impact of vegetation canopy structure on semidesert microclimates. Protected areas in the Negev possess a substantially lower surface albedo than adjacent degraded lands in the Sinai Peninsula (Otterman 1974, 1977, 1981; Otterman and Tucker 1985). High-albedo overgrazed soils in Sinai can be several degrees cooler than vegetated soils in the Negev during the day, yet daytime sensible heat flux from vegetated surfaces is up to twice as high as bare soils (Otterman 1989). Shading of soil by vegetation reduces ground heat flux, while the warmer vegetated surface provides greater heating to the atmosphere, promoting boundary-layer growth and thermal convection (Otterman 1974, 1989).
In a key field trial, Rotenberg and Yakir (2010, 2011) evaluated the energy balance of a 40-year-old pine forest (Pinus halepensis) planted in semiarid southern Israel versus native shrubland.
· 1st structural property: The forest had a leaf area index of ~1.4 m² m⁻², a canopy height of 11 m, and tree cover of ~56%.
· 2nd structural property: The native shrubland featured a sparse canopy (20% cover) and short height (30–50 cm).
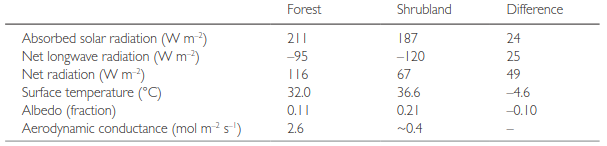
Table 28.5 Forest and shrubland measurements in the semiarid climate of southern Israel. Note: The difference is given as forest - shrubland. Surface temperature is during the day. Conductances are for midday and are converted to mol m⁻² s⁻¹ using ρₘ = 42.3 mol m⁻³. The conductance for shrubland is estimated. Source: From Rotenberg and Yakir (2011).
Despite absorbing 24 W m⁻² more solar radiation annually, the forest surface temperature was on average 4.6 °C cooler during the day than the shrubland. The open canopy architecture created strong aerodynamic coupling with the atmosphere, allowing high sensible heat fluxes to efficiently dissipate heat away from the canopy into the boundary layer.
Biogeophysical feedbacks and drought in the Sahel. The Sahel region of West Africa—positioned between the Sahara Desert to the north and tropical rainforests to the south—is a major focus of land-atmosphere interaction research (Nicholson et al. 1998; Nicholson 2000; Foley et al. 2003; Xue et al. 2004, 2006).
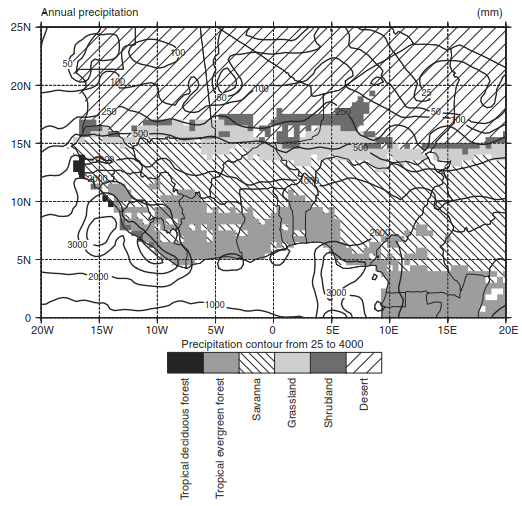
Fig. 28.3. Land cover and mean annual rainfall in northwest Africa. The Sahel refers to the region between latitudes 13° N and 20° N and longitudes 15° W and 20° E (Foley et al. 2003).
Annual precipitation in the Sahel was severely below normal during the late 20th century. Between 1968 and 1997, rainfall was 25–40 percent lower than during the 1931–1960 period.
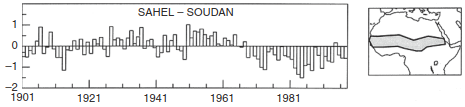
Fig. 28.4. Rainfall fluctuations over the twentieth century in the Sahel region of West Africa expressed as a standardized departure from the long-term mean. The map shows the location of the region. Reproduced from Nicholson (2000).
To explain this persistent drought, Charney (1975) proposed a classic biogeophysical feedback mechanism initiated by overgrazing and vegetation removal.
· 1st stage: Overgrazing reduces vegetation cover, exposing lighter desert soil and increasing surface albedo.
· 2nd stage: Elevated albedo decreases net solar radiation absorption at the ground surface, producing a net cooling effect.
· 3rd stage: Reduced surface heating leads to atmospheric subsidence (sinking air aloft).
· 4th stage: Subsidence suppresses convective cloud formation and vertical motion, suppressing rainfall.
· 5th stage: Reduced rainfall further degrades vegetation cover, reinforcing the drying cycle.
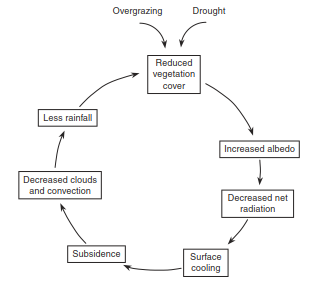
Fig. 28.5. Feedbacks between vegetation and climate during desertification. Adapted from Charney (1975).
Numerical modeling by Clark et al. (2001) expanded Charney's albedo framework to include changes in surface roughness length, leaf area index, and soil hydraulic properties resulting from desertification.
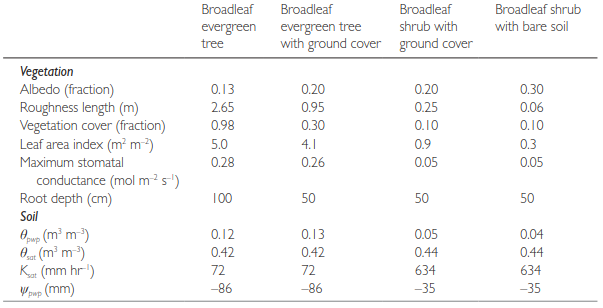
Table 28.6 Surface and soil characteristics for four common vegetation types in the Sahel region of Africa. Note: θ_pwp, volumetric moisture content at wilting point. θ_sat, volumetric moisture content at saturation. K_sat, hydraulic conductivity at saturation. ψ_pwp, matric potential at saturation. Albedo, roughness length, and leaf area index are averages for July–September. Stomatal conductance is converted to mol m⁻² s⁻¹ using ρₘ = 42.3 mol m⁻³. Source: From Clark et al. (2001).
Simulating land degradation across the Sahel resulted in a clear suppression of monsoonal precipitation.
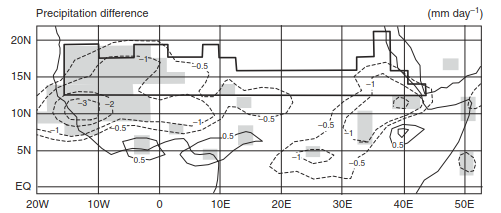
Fig. 28.6. Simulated change in precipitation (mm day⁻¹) for the months of July–September due to land degradation in the Sahel. Differences that are statistically significant at the 95 percent confidence level are shaded. The thick line shows the region of land degradation. Adapted from Clark et al. (2001).
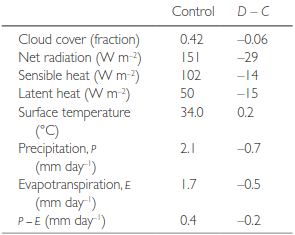
Table 28.7 Effect of Sahel land degradation on surface climate during the months of July–September. Note: Data are averaged over the degraded area. Control, control simulation. D - C, difference between the degraded and control simulations. Source: From Clark et al. (2001).
Throughout the degraded Sahelian domain, simulated precipitation ($P$) decreased by 0.7 mm day⁻¹ (33%), evapotranspiration ($E$) decreased by 0.5 mm day⁻¹ (30%), and net moisture convergence (P - E) fell by 0.2 mm day⁻¹ (50%).
Regional surface flux partitioning in West Africa. Modern empirical observations confirm that land surface properties establish a steep latitudinal gradient in surface energy fluxes across West Africa (Samain et al. 2008; Guichard et al. 2009; Timouk et al. 2009; Taylor et al. 2011). Surface albedo increases with aridity from south to north, ranging from 0.1–0.2 in southern savannas to >0.4 in northern semideserts.
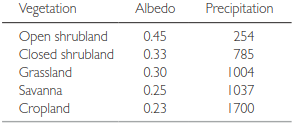
Table 28.8 Mean annual albedo (fraction) and annual precipitation (mm) by vegetation type in West Africa. Source: From Fuller and Ottke (2002).
· 1st seasonal phase: During the dry season, sensible heat flux dominates while latent heat flux remains low across bare soils and semideserts.
· 2nd seasonal phase: The arrival of summer monsoonal rains wets the soil and triggers rapid leaf emergence in grasslands and woodlands.
· 3rd seasonal phase: Increased green foliage decreases surface albedo, elevating net radiation and shifting the dominant turbulent surface energy flux to latent heat.
Aircraft transects reveal that early afternoon boundary layers over wet soils are up to 3 °C cooler, 3 g kg⁻¹ moister, and half as deep as those over dry soils (Taylor et al. 2007). Current scientific consensus integrates sea surface temperature anomalies (Kucharski et al. 2013) with land-atmosphere interactions (Foley et al. 2003), showing that ocean temperature shifts initiate rainfall deficits, while local vegetation feedbacks amplify and sustain multidecadal drought states.
Date added: 2026-09-24; views: 2;