
Coupled Climate–Vegetation Dynamics and Ecosystem Feedbacks
Coupled Climate–Vegetation Dynamics. The simplest depiction of coupled climate–vegetation dynamics is Daisyworld (Watson and Lovelock 1983; Wood et al. 2008). Daisyworld is a mathematical model of a planet with two types of daisies of different colors. One is black, has a low albedo, and reflects less solar radiation than soil. The other is white, has a high albedo, and reflects more solar radiation than soil. Black daisies, with their lower albedo, absorb more solar radiation and are locally warmer than white daisies. The growth of daisies depends on local temperature scaled to zero at temperatures of 5 °C and 40 °C and optimum at 22.5 °C.
Theoretical Climate Regulation. This introduces a feedback in which the extent of daisy coverage affects temperature, which in turn affects daisy growth and coverage. Black daisies are warmer than white daisies and dominate in cold climates. However, an increase in the area of black daisies lowers planetary albedo, warms climate, and creates conditions in which white daisies are favored. White daisies have the opposite effect.
· Cold climates occurring at low luminosity favor black daisies because they warm the planet.
· White daisies are at a disadvantage because they create locally colder temperatures.
· As black daisies spread across the planet, temperature increases.
· Their growth declines in the warm climate above 22.5 °C while that of white daisies increases.
· As solar luminosity increases, the area of black daisies declines while that of white daisies, which cool the planet, increases.
· Across a wide range of luminosity, planetary temperature is close to optimum, and only at high or low luminosity is temperature too hot or cold for life.
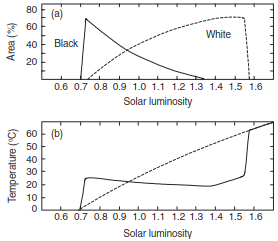
Fig. 27.3. Steady state response of Daisyworld to solar luminosity. Luminosity is the fractional change in solar constant. (a) Area of black and white daisies. (b) Planetary temperature. The dashed line shows planetary temperature without daisies. Adapted from Watson and Lovelock (1983).
Paleoclimatic Dynamics of Northern Africa. The Sahara Desert is a well studied example of the importance of vegetation to climate. About 6000 years before present (6 kyr BP), the climate of North Africa was much wetter than today (Street-Perrott and Perrott 1993; Joussaume et al. 1999; Braconnot et al. 2000, 2007). Milankovitch changes in orbital geometry increased summer solar radiation (Fig. 8.4), heated the land, and strengthened the African summer monsoon. Paleobotanical data indicate grasses and shrubs covered much of North Africa, including areas that are presently desert, as a result of the wetter climate (Hoelzmann et al. 1998; Jolly et al. 1998; Prentice et al. 2000).
Monsoonal Amplification Mechanics. Climate simulations show that expansion of grasses and shrubs in response to increased summer precipitation amplified the precipitation response to orbital geometry. Decreased surface albedo and increased evapotranspiration as the desert soil was vegetated strengthened the monsoonal rains. One approach to examine vegetation feedbacks is to simulate the climate of North Africa for the period 6 kyr BP with desert replaced by vegetation. Climate model experiments by Kutzbach et al. (1996) illustrate this methodology (Table 27.1).
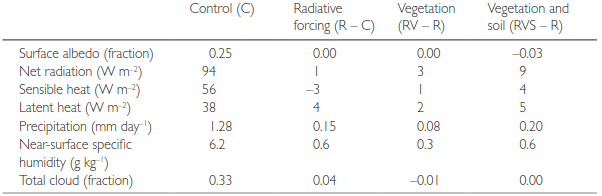
Table 27.1. Effect of vegetation and soil on the annual mean climate of North Africa 6 kyr BP as determined from four climate model simulations. Note: C, control simulation with modern solar radiation and vegetation. R, orbital geometry of 6 kyr BP and modern vegetation. RV, orbital geometry and vegetation of 6 kyr BP. RVS, orbital geometry, vegetation, and soil of 6 kyr BP. Radiative forcing is the difference between the radiative (R) and control (C) simulations. Vegetation and soil forcings are the climate change in addition to the radiative forcing. Data are averaged between latitude 15–22° N and longitude 0–50° E. Source: From Kutzbach et al. (1996).
Modeling Sahelian Land Surface Feedbacks. A control simulation was performed for modern conditions. A second simulation used the orbital geometry of 6 kyr BP but with modern desert vegetation. In a third simulation for 6 kyr BP, vegetation between latitudes 15° N and 30° N was changed from desert to grassland. A fourth simulation additionally increased soil water-holding capacity and reduced soil albedo.
· Greater summer solar radiation due to orbital geometry increases annual precipitation between latitude 15° N and 22° N by 12 percent compared with the control simulation.
· Cloud cover increases, as does atmospheric moisture.
· Latent heat flux increases because of more net radiation at the surface and because the soils are wetter.
· Replacement of desert with grassland and soil enhances the summer monsoon, and the climatic response equals or exceeds that of the orbital forcing alone.
· Net radiation increases as a result of reduced albedo, latent heat flux increases, and the near-surface atmosphere moistens.
· Annual precipitation increases by 18 percent in the grassland simulation and by 28 percent in the grassland and soil simulation compared with the control simulation.
· The increase in precipitation reduces the area of the Sahara by 11 percent due to orbital forcing alone and by 20 percent due to feedback from vegetation and soil changes.
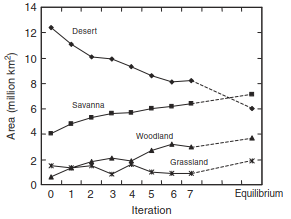
Fig. 27.4. Area of vegetation in North Africa (latitude 8.5°–36.6° N, longitude 15.5° W–52.0° E) 6 kyr BP in relation to iteration for an asynchronously coupled climate–vegetation model. Adapted from Claussen and Gayler (1997).
Asynchronous Equilibrium Coupling. Climate simulations with asynchronous equilibrium vegetation coupling simulate vegetation change rather than prescribing vegetation change (Fig. 25.12a). These studies also show that the geographic expansion of vegetation enhanced the summer monsoon 6 kyr BP. Figure 27.4 shows changes in vegetation cover during one such climate–vegetation simulation (Claussen and Gayler 1997). The climate model was forced with the solar radiation of 6 kyr BP, and vegetation was simulated with a biogeography model. From an initial condition of extensive desert and sparse savanna, interactive vegetation changes climate such that desert shrinks while savanna, woodland, and grassland expand. The climate–vegetation model converges on an equilibrium solution in which desert is reduced by 50 percent from its initial extent, representing a northward shift of savanna of some 600 km in the western region of the Sahara.
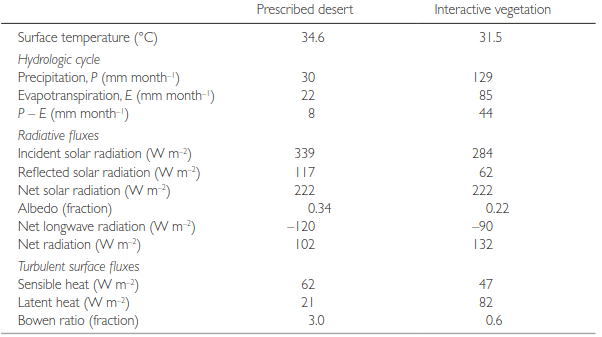
Table 27.2. North Africa summer climate 6 kyr BP from climate simulations with prescribed modern desert vegetation and with coupled vegetation. Note: Data are averaged for June–August and are spatially averaged between latitude 15–30° N and longitude 10° W–30° E. Source: From Claussen and Gayler (1997).
Equilibrium State Energy Dynamics. The northward shift of savanna amplifies the climate response to orbital forcing (Table 27.2). With interactive vegetation, surface temperature cools by 3.1 °C and precipitation quadruples compared with a simulation that used a prescribed desert surface. Evapotranspiration increases because of wetter soils, but net water gain (P - E) increases from 8 mm per month with desert to 44 mm per month with interactive vegetation.
· The cooler, wetter climate alters net radiation at the surface and the partitioning of this energy into latent and sensible heat.
· The vegetated surface receives 30 W m⁻² more net radiation than the desert, which is used to evaporate water.
· The Bowen ratio (i.e., the ratio of sensible to latent heat) decreases from 3.0 with desert to 0.6 with interactive vegetation.
· The simulated climate and biogeography is in better agreement with observations with interactive vegetation than without.
Synchronous Dynamic Coupling. Other climate simulations with synchronously coupled dynamic vegetation models (Fig. 25.12b) also show that desert greening enhances precipitation (Claussen 2009). For example, Levis et al. (2004) performed five climate model simulations:
· 1st simulation (0k0v): A control with present-day climate forcings (greenhouse gases, orbital geometry) and prescribed present-day vegetation.
· 2nd simulation (6k0v): Climate forcings for 6 kyr BP and prescribed present-day vegetation.
· 3rd simulation (6k6v): Climate forcings for 6 kyr BP and dynamic vegetation.
· 4th simulation (6k6vt): As in 6k6v but with loam soil to increase soil water-holding capacity.
· 5th simulation (6k6vtc): As in 6k6v but with loam soil and decreased soil albedo.
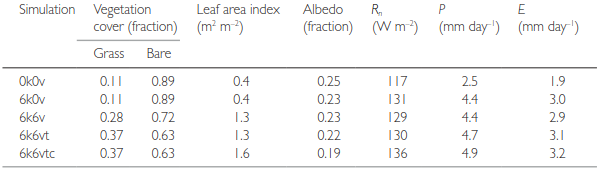
Table 27.3. Vegetation and soil feedback on North Africa summer climate 6 kyr BP as determined from climate model simulations with dynamic vegetation. Note: 0k0v, present-day climate and vegetation. 6k0v, climate 6 kyr BP and present-day vegetation. 6k6v, 6 kyr BP climate and dynamic vegetation. 6k6vt, as in 6k6v but with loam soil texture and present-day soil color. 6k6vtc, as in 6k6v but with loam soil texture and decreased soil albedo. Rn, net radiation. P, precipitation. E, evapotranspiration. Data are averaged for July–September and are spatially averaged between latitude 15–25° N and longitude 12° W–34° E. Source: From Levis et al. (2004).
Sensitivity to Surface Albedo. Climate forcings alone show an enhanced North Africa summer monsoon, as expected from prior studies (Table 27.3, 6k0v). Summer precipitation is 79 percent greater than in the control simulation (0k0v). With dynamic vegetation (6k6v), grasses encroach northwards and cover 28 percent of the surface (versus 11 percent present-day). However, this expansion of vegetation does not increase precipitation compared with that from climate forcings alone (6k0v).
In part, this is because the desert soil does not increase soil water retention or decrease surface albedo. Change to loam soil does increase evapotranspiration and precipitation slightly (6k6vt), and lower soil albedo further reinforces these increases (6k6vtc). These results point to the importance of surface albedo when simulating a positive land feedback on precipitation, similar to the findings of Kutzbach et al. (1996) shown in Table 27.1. Other studies also indicate the magnitude of the positive precipitation feedback is sensitive to surface albedo (Bonfils et al. 2001; Knorr and Schnitzler 2006). However, vegetation does not advance far enough northward in these simulations to match paleobotanical data. While dynamic vegetation does improve simulation of the North African monsoon, additional feedbacks are necessary in this climate model to sustain a vegetated Sahara and to match paleoclimate reconstructions.
Abrupt Transitions and Alternative Stable States. The period 6 kyr BP was part of a longer time beginning about 14.5 kyr BP when the climate of North Africa was much wetter than today (Foley et al. 2003). Then, between 6–5 kyr BP, climate abruptly became drier and the vegetation became desert. Climate model simulations suggest that this shift is related to changes in orbital geometry that weakened the summer monsoon and that vegetation feedback on precipitation amplified this change (Claussen 2009). Claussen et al. (1999, 2003) used a climate model of intermediate complexity in a transient simulation of climate from 9 kyr BP to present-day.
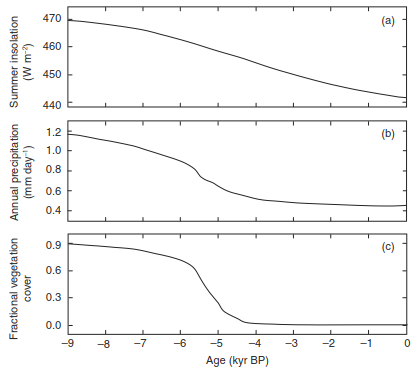
Fig. 27.5. Transient climate simulations for the past 9 kyr BP. (a) Summer (June–August) insolation averaged for the Northern Hemisphere. (b) Annual precipitation in the Sahara (spatially averaged between latitude 20°–30° N and longitude 15° W–50° E). (c) Fractional vegetation cover for the Sahara. Adapted from Claussen et al. (1999). Temporal trends in precipitation and vegetation are smoothed compared with the original figures.
Mechanism of Desertification Regime Shifts. The model was forced only with changes in orbital parameters, which leads to a gradual reduction in summer insolation in the Northern Hemisphere (Fig. 27.5). Precipitation in the Sahara decreases gradually until about 5.6 kyr BP, when both precipitation and vegetation cover decrease markedly over a few hundred years. These results suggest that slow changes in solar radiation caused by Earth's orbital geometry gradually reduced precipitation. At some point, this gradual reduction in precipitation was abruptly amplified, likely by vegetation feedback, and the system switched from vegetated to desert.
· Other studies suggest a gradual drying of climate, implying weak climate–vegetation feedback.
· However, strong climate–vegetation feedback can produce a gradual decline in precipitation and transition to desert if a diversity of species with different sensitivity to soil wetness co-occur (Claussen et al. 2013).
· The notion of a regime change is supported by other coupled climate–vegetation model studies that indicate the possibility of two different stable states in North Africa: a wet climate with a vegetated Sahara or a dry climate with desert.
· For example, climate model studies in which vegetation is simulated asynchronously using a biogeography model show that the choice of initial vegetation cover of desert or forest can lead to different climates in the western region of the Sahara Desert (Claussen 1994, 1997, 1998; Claussen et al. 1998; Kubatzki and Claussen 1998).
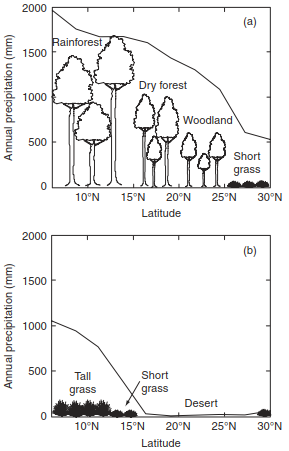
Fig. 27.6. Equilibrium climate and vegetation in West Africa in relation to latitude for (a) forest initial conditions and (b) desert initial conditions. Adapted from Wang and Eltahir (2000a).
Sensitivity to Initial Conditions. Under present-day orbital forcing, simulations when the model is initialized with the modern geographic extent of desert produce the present-day climate and distribution of vegetation. However, simulations in which land is initially vegetated instead of desert result in a wetter climate that supports a northward extension of savanna and shrubland from their modern distributions. A similar dichotomy of two stable climate–vegetation states is possible 21 kyr BP at the last glacial maximum but not 6 kyr BP, when a green Sahara is the only model solution. Six thousand years ago, increased summer solar radiation strengthened the monsoon and created a climate that was wet enough to maintain vegetation regardless of vegetation feedback. In contrast, the drier climate of today and at the last glacial maximum as a result of reduced summer solar radiation is sensitive to vegetation feedback.
Climate simulations by Wang and Eltahir (2000a) that used a dynamic global vegetation model also show two stable climate–vegetation regimes depending on initial conditions (Fig. 27.6). An initial forest cover produces a climate–vegetation equilibrium with large annual rainfall and extensive forest vegetation over much of West Africa. Desert initial conditions give substantially less rainfall, an absence of forest, and wide distribution of grasses and desert. The existence of two stable climate–vegetation states (wet-green, dry-desert) in coupled models suggests that vegetation feedback plays an important role in the climate of this region.
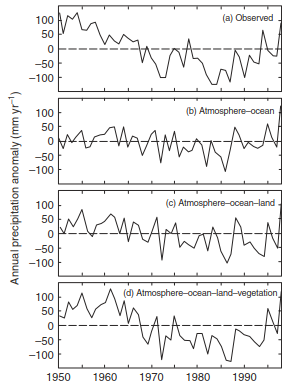
Fig. 27.7. Precipitation variability and vegetation feedback in the West African Sahel (latitude 13°–20° N, 15° W–20° E) for 1950–1998. (a) Observed annual precipitation anomaly. (b) Simulated annual precipitation anomaly with sea surface temperatures only. (c) Simulated annual precipitation anomaly with the addition of interactive soil moisture. (d) Simulated annual precipitation anomaly with the addition of vegetation feedback. Adapted from Zeng et al. (1999).
Sahelian Drought Amplification and Global Atmospheric Links. Other studies with coupled climate–vegetation models also point to the importance of vegetation and soil moisture feedbacks in the Sahel region of northern Africa (Zeng et al. 1999; Wang and Eltahir 2000b,c; Wang et al. 2004; Kucharski et al. 2013). This region experienced a severe drought during the latter part of the twentieth century. While changes in sea surface temperatures drive decadal precipitation variability, vegetation and soil moisture feedbacks enhance the variability and the severity of drought.
For example, Zeng et al. (1999) compared oceanic and terrestrial influences on precipitation variability for the period 1950–1998 (Fig. 27.7). A simulation with interannually varying sea surface temperatures and prescribed soil moisture and vegetation cover has weak interannual precipitation variation and drying compared with the observations. Interactive soil hydrology increases the drying trend and provides a better match with observations, but the best fit with observations occurs when vegetation also responds to precipitation. Interactive vegetation influences precipitation through a positive feedback loop:
· Decreased rainfall leads to drier soils and reduced vegetation cover.
· Reduced cover leads to higher surface albedo and reduced transpiration.
· This weakens atmospheric circulation by reducing the energy and water flux in the atmosphere, resulting in less rainfall.
In summary, a large body of literature shows that vegetation and soil moisture feedbacks are a key component of the climate of North Africa. These feedbacks enhance orbital changes in the North Africa summer monsoon, and climate models that represent these feedbacks better match paleoclimatic and paleobotanical data. The consensus is that the climate of North Africa 6 kyr BP cannot be realistically simulated without vegetation feedback on climate. Moreover, the occurrence of persistent drought in this region is triggered by forcings such as sea surface temperature but accentuated by vegetation and soil moisture feedbacks.
However, there is still much to learn about vegetation–climate coupling in North Africa. Remote forcing from expanded forest cover in Eurasia may have contributed to the enhanced precipitation over North Africa 6 kyr BP. An increase in present-day extratropical forest cover decreases surface albedo and increases energy absorption in the Northern Hemisphere. The Hadley circulation moves northward to redistribute the energy, also shifting the intertropical convergence zone (ITCZ) northward (Fig. 28.20). The same mechanism may have prevailed 6 kyr BP, forced by more extensive forests in Eurasia and grassland in the Sahara that increased energy absorption and as a result produced greater precipitation over North Africa (Swann et al. 2014).
Boreal Forest–Tundra Climate Dynamics & Ecosystem Feedbacks
Boreal Forest Dynamics and Global Climate Regulation. The boreal forest is the northernmost forest, lying just south of the treeless tundra. Because of differences between boreal forest and tundra in surface albedo, surface roughness, and the partitioning of energy into latent and sensible heat, the geographic extent of these biomes is an important regulator of global climate (Bonan et al. 1995; Chapin et al. 2000, 2005; Eugster et al. 2000).
Surface Albedo Dynamics and Snow Masking. One important difference is surface albedo when snow covers the ground. Fresh snow has a high albedo, generally reflecting 80–95 percent of incident solar radiation (Table 12.1). This is also true for short tundra vegetation, which is typically buried by snow. The high albedo of snow in contrast with snow-free surfaces is an important climate feedback (Qu and Hall 2007; Fletcher et al. 2012), but the presence of trees diminishes this difference. Tall trees protrude over snow-covered ground. Foliage has a much lower albedo than snow, and dense canopies of leaves mask the high albedo of snow (Figure 17.5b). This vegetation masking of snow albedo is seen locally in comparison of summer and winter albedos for various boreal ecosystems (Table 27.4). Treeless areas have a much higher albedo when snow is on the ground than do forests. Evergreen pine and spruce forests have low albedo in winter. Even deciduous quaking aspen forests have comparatively low winter albedo because of twigs, branches, and stems. Shrubs similarly reduce albedo compared with tundra, especially during the snowmelt season (Figure 27.8). Vegetation masking of snow albedo is evident in satellite-derived maps of surface albedo during winter (Robinson and Kukla 1985; Jin et al. 2002; Barlage et al. 2005; Gao et al. 2005). Such maps show forests have a lower albedo than treeless regions, which is also evident in comparisons among biomes (Figure 12.10, Table 26.3) and seen also in a decline in albedo with greater tree cover (Loranty et al. 2014).
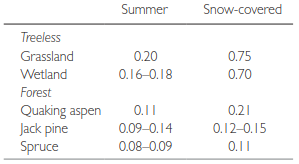
Table 27.4. Daily averaged broadband albedo (fraction) during summer and with snow for boreal vegetation. Source: From Baldocchi et al. (2000).
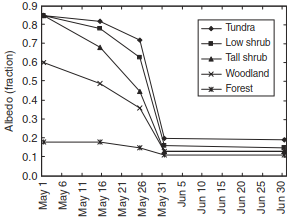
Fig. 27.8. Surface albedo of arctic vegetation during snowmelt, May 1–June 30. Data from Sturm et al. (2005a). See also Loranty et al. (2011).
Climate Model Simulations of Boreal Warming. Climate model simulations show that the boreal forest warms climate, primarily because of its low albedo in winter and spring (Bonan et al. 1992; Thomas and Rowntree 1992; Foley et al. 1994; Betts 2000; Snyder et al. 2004; Davin and de Noblet-Ducoudré 2010). Figure 27.9 shows results from one study that compared climate simulations with the boreal forest present and with boreal forest replaced with tundra (Bonan et al. 1992). In January, temperatures for the region bounded by latitudes 40° N and 70° N are 3–7 °C warmer in climate simulations with the boreal forest than without. The largest warming occurs in April. Warming persists into summer (July) and autumn (October) despite smaller differences in surface albedo between forest and tundra because warmer oceans and reduced sea ice feed back to warm climate. When compared among various global biomes, boreal forest has the greatest effect on annual mean temperature as a result of large changes in albedo (Snyder et al. 2004).
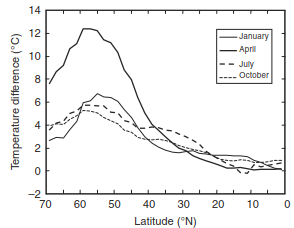
Fig. 27.9. Difference in air temperature between a climate simulation with the boreal forest present and one in which the boreal forest is replaced with tundra. Data show January, April, July, and October mean monthly temperature averaged for land as a function of latitude from the equator (0° N) to 70° N. Adapted from Bonan et al. (1992).
Paleoclimatic Feedbacks and Glacial Inception. This vegetation feedback on climate has been found at other times. For example, climate was warmer than present during the late Cretaceous 66 million years ago when atmospheric CO₂ concentration was much higher than present (580 ppm). Polar deciduous forest covered the Arctic in this warm climate. Otto-Bliesner and Upchurch (1997) simulated the late Cretaceous climate once with unvegetated land and again with vegetation geography for that time. These simulations show that polar forests warm climate by reducing albedo compared with simulations without forests. Inclusion of polar forests results in a simulated climate that agrees better with reconstructions from fossil vegetation data, suggesting these forests were an important contributor to the warm climate of this period.
The forest–tundra ecotone may play a role in glaciation. At the onset of the last glaciation 115 kyr BP, Northern Hemisphere summer solar radiation was reduced by 8 percent compared with modern values and atmospheric CO₂ was 267 ppm. Climate model simulations by Gallimore and Kutzbach (1996) show that these changes in solar radiation and atmospheric CO₂ cool high latitude land temperature by about 5 °C and increase the duration of snow cover by about one month compared with a control simulation of the present-day climate (Table 27.5). Observational evidence shows widespread changes in vegetation 115 kyr BP because of the colder climate. High latitude forests died back and were replaced with tundra and cold grassland-like vegetation. Gallimore and Kutzbach (1996) performed two additional climate simulations to examine the effects of the increased albedo associated with the expansion of tundra. In one simulation, surface albedo north of 60° N was increased to mimic reduced vegetation masking of snow albedo with modest tundra expansion. In another simulation, surface albedo was increased even more to mimic large loss of forest and extensive expansion of tundra. Increases in surface albedo with a modest expansion of tundra cools climate by an additional 2.9 °C in North America and 2.8 °C in Eurasia and increases the duration of snow on the ground by 18 days compared with radiative forcings. A more extensive tundra with a larger increase in albedo results in a catastrophic climate change, with summer temperatures decreasing 17–18 °C and snow cover persisting almost three months longer compared with no changes in tundra. Regions of permanent snow cover occur, indicating the onset of glaciation.
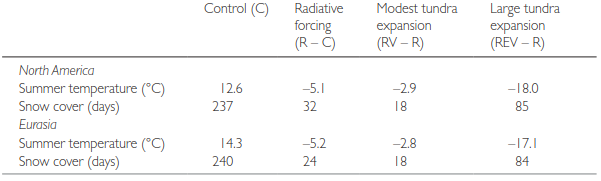
Table 27.5. Climate at the onset of glaciation 115 kyr BP as determined from four climate model simulations. Note: C, control simulation with present-day solar radiation and atmospheric CO₂. R, orbital geometry and atmospheric CO₂ of 115 kyr BP. RV, as in R but with modest expansion of tundra that increases surface albedo north of 60° N. REV, as in RV but with greater increase in albedo because of extensive tundra expansion. Data are averaged over land between latitudes 60°–90° N. Radiative forcing is the difference between the radiative and control simulations. Vegetation forcings are the climate change in addition to the radiative forcing. Source: From Gallimore and Kutzbach (1996).
Amplification of Orbital Forcing in Paleoclimate. Coupled climate–vegetation models confirm that vegetation provides a positive feedback for glacial inception (de Noblet et al. 1996; Meissner et al. 2003; Calov et al. 2005; Claussen et al. 2006; Kubatzki et al. 2006). In these simulations, the cold climate as a result of reduced solar radiation and lower atmospheric CO₂ decreases the geographic extent of the boreal forest, and the expansion of tundra leads to additional cooling. Similar results are found at other time periods (Horton et al. 2010).
Coupled climate–vegetation models highlight the importance of vegetation in amplifying the climate response to orbital forcing at the last glacial maximum. For example, Levis et al. (1999) compared climate simulations of the last glacial maximum using prescribed present-day vegetation and with vegetation simulated by a dynamic global vegetation model. When vegetation is allowed to respond to the cold, dry glacial climate, forest cover decreases in the tropics and northern latitudes. Instead, tundra dominates much of the middle to high latitudes while grasslands cover the tropics and subtropics. These changes in biogeography are consistent with fossilized plant remains, which show more extensive tundra and grasses in middle to high latitudes and forest dieback and replacement by grasses in the tropics. The simulated climate is quite different as a result of the dynamic vegetation. With dynamic vegetation, temperatures cool compared with present-day vegetation over much of Eurasia, where tree cover decreases and albedo increases in winter and spring. Temperatures warm in the tropics and subtropics where grasses replace trees and evapotranspiration is reduced in a drier climate.
The location of the treeline separating forest and tundra changed over the past 18 kyrs with the transition from glacial to interglacial (Figure 24.17). As climate warmed and glaciers retreated northwards, the treeline migrated northwards. The period 6 kyr BP is particularly noteworthy. Changes in Earth's orbital geometry resulted in more summer solar radiation than present in the Northern Hemisphere (Figure 8.4), creating a warmer climate than present. Boreal forests extended north of the modern treeline in response to this warm climate. Foley et al. (1994) showed that the decrease in surface albedo caused by northward expansion of forest accentuated the warming. They simulated climate in response to the orbital geometry of 6 kyr BP. This orbital forcing warms high latitude land between 60° N and 90° N by 1.8 °C in the annual mean. In another simulation, the authors extended the northern limit of boreal forest and reduced the extent of tundra. The northward expansion of forest gives an additional warming of 1.6 °C, which is comparable to that of the orbital forcing alone. This additional warming is larger in spring (4 °C) than in other seasons (1 °C). Other model studies also show amplification of the climate warming due to vegetation feedback (Claussen 2009).
Surface Energy Partitioning and Evapotranspiration. The influence of the boreal forest on climate is more complex than just albedo. Forest and tundra ecosystems differ in their energy balance. Beringer et al. (2005) compared summer surface fluxes at five sites in Alaska representing tundra, low deciduous shrub, tall deciduous shrub, woodland treeline, and white spruce forest (Table 27.6). Albedo decreased with increased woody stature from 0.19 (tundra) to 0.10 (forest). The bulk aerodynamic conductance increased by a factor of four from tundra to forest. Evaporative fraction and bulk surface conductance were virtually identical across sites because evaporation decreased while transpiration increased along the tundra–forest transect. The Bowen ratio increased from 0.94 (tundra) to 1.22 (forest), indicative of warmer and drier sites along the transect.
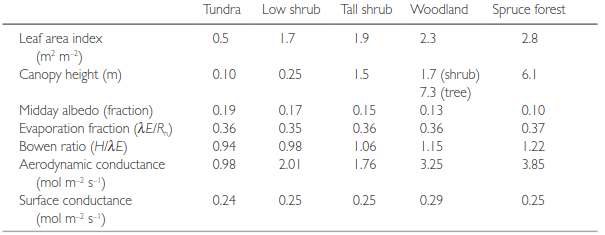
Table 27.6. Summer vegetation characteristics and surface energy fluxes at five sites in Alaska. Note: Rₙ, net radiation. H, sensible heat flux. λE, latent heat flux. Conductances are for midday and are converted to mol m⁻² s⁻¹ using ρₘ = 42.3 mol m⁻³. Source: From Beringer et al. (2005).
The various types of boreal vegetation also differ in latent heat exchange (Table 27.7). Summertime evaporative fraction is largest over wetland and quaking aspen forests where about two-thirds to three-quarters of energy is dissipated as latent heat. Needleleaf forests such as jack pine, Scots pine, black spruce, and larch, on the other hand, have evaporative fraction ranging from one-third to one-half of available energy. Low foliage nitrogen, low photosynthetic capacity, low leaf area, high vapor pressure deficit, soil moisture deficit, and other factors combine to restrict canopy conductance in boreal needleleaf forests.
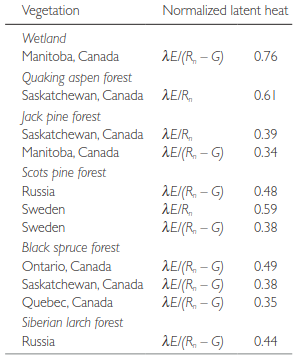
Table 27.7. Mid-growing season latent heat flux (λE) normalized by net radiation (Rₙ) or available energy (net radiation minus soil heat flux, Rₙ - G) for various boreal vegetation. Source: From Baldocchi et al. (2000).
These differences in evapotranspiration affect climate. Climate model simulations show that expansion of broadleaf deciduous trees in the Arctic north of 60° N not only decreases land surface albedo, but also increases evapotranspiration on land (Swann et al. 2010). Water vapor in the atmosphere is a powerful greenhouse gas. Increased water vapor warms the Arctic climate and initiates a positive feedback whereby warmer temperature melts sea ice, which decreases ocean albedo and increases evaporation from the ocean, producing still greater warming. This feedback increases annual mean temperature in the Arctic by up to 3 °C in some regions and by 1 °C over the circumpolar Arctic. The radiative forcing from higher transpiration with expanded forest cover is greater than that from surface albedo changes alone. Another study similarly found warming as a result of increased evapotranspiration and atmospheric moisture with deciduous shrub encroachment into tundra (Bonfils et al. 2012).
Disturbance Regimes: Wildfires and Insect Infestations. Changes in the disturbance regime can also affect climate. Post-fire forest succession drives differences among forests in their surface energy balance (Liu et al. 2005; Amiro et al. 2006; Liu and Randerson 2008). Surface albedo decreases as the burned forest recovers from fire (Figure 22.15). Recent burn sites have lower summer net radiation compared with mature spruce forests because of higher albedo (Table 22.4). The Bowen ratio of young aspen forest during summer (0.9) is lower than that of mature spruce forest (1.3) and its evaporative fraction (0.5) is higher (0.4). In general, there is a clear temporal trend in fluxes related to the immediate fire, regrowth by deciduous trees, and recovery of the mature spruce forest.
Changes in the fire regime alter the age and composition of the boreal forest and thus can alter climate. Climate model simulations show that younger forests arising from increased burning cool the North American boreal climate, primarily in winter and spring (Rogers et al. 2013). A doubling of burn area cools the surface climate by 0.23 °C across boreal North America during winter and spring (December–May). This is driven by increases in surface albedo; in these simulations evapotranspiration feedbacks are minor.
The mountain pine beetle epidemic in western North America forests has killed vast tracts of forests in British Columbia and the Rocky Mountain region of the United States (Edburg et al. 2012). This mortality increases surface albedo, most noticeably in winter and spring (O'Halloran et al. 2012; Bright et al. 2013; Vanderhoof et al. 2013, 2014). The mortality also decreases evapotranspiration. Such changes are evident in British Columbia (Maness et al. 2013). Over the beetle infested region, summertime evapotranspiration decreased by 19 percent and summertime surface temperatures increased by 1 °C rise as a result of tree dieback. The largest decreases in evapotranspiration and warming of daytime temperature relative to nighttime temperature occurred in stands that suffered the greatest mortality (Figure 27.10). Similar changes have occurred in other beetle infested regions (Bright et al. 2013).
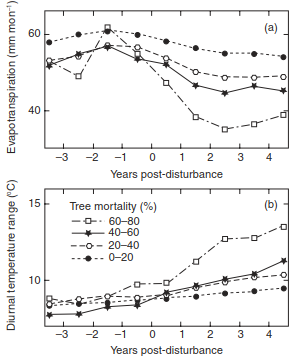
Fig. 27.10. Time series of (a) summertime evapotranspiration and (b) diurnal temperature range in British Columbia before and after pine beetle infestation in relation to degree of forest mortality. Adapted from Maness et al. (2013).
Wildfires and insect infestations affect climate through a variety of biogeochemical processes. Pine beetle mortality reduces carbon uptake by forests (Kurz et al. 2008). Wildfires emit CO₂, CH₄, N₂O, and aerosols to the atmosphere, but carbon accumulation increases as the forests recover (Figure 22.16). The net effect of disturbances must consider these biogeochemical changes in addition to biogeophysical forcings (Randerson et al. 2006). In boreal spruce forests, for example, the positive biogeochemical radiative forcing exceeds the negative biogeophysical radiative forcing in the first year following fire, but the opposite is true over longer time periods (Table 23.1).
Ecological Perspectives and Atmospheric Fronts. Ecologists have historically thought that climate determines the geography and functioning of the boreal forest (Larsen 1980; Bonan and Shugart 1989; Shugart et al. 1992; Hall et al. 2004). For example, the northern and southern boundaries of the boreal forest correlate with the July 13 °C and 18 °C isotherms, respectively. However, these correlations likely reflect coupled climate–vegetation dynamics in which the geographic extent of the boreal forest affects and is affected by climate. In addition, the forest–tundra ecotone correlates with the summer position of the Arctic front (Bryson 1966; Krebs and Berry 1970). The forest–tundra ecotone may itself control the position of this front in summer due to the large contrast in surface albedo, surface roughness, and energy exchange, which results in strong heating of the atmosphere over forest and weaker heating over tundra (Pielke and Vidale 1995). Model simulations are inconclusive (Lynch et al. 2001; Liess et al. 2012; Snyder and Liess 2014), though the simulations differ in model resolution and domain.
Date added: 2026-09-24; views: 1;