
Biochemistry of Photosynthetic Pathways and Carbon Fixation Dynamics
Photosynthesis utilizes the chemical energy (ATP and NADPH) generated during light-dependent reactions to reduce inorganic carbon dioxide (CO₂) into complex carbohydrates. In most plant species, the primary stable intermediate produced during carbon fixation contains three carbon atoms, defining the C₃ photosynthetic pathway. The enzymatic steps converting CO₂ into triose phosphates are collectively designated as the Calvin cycle, which operates via three tightly regulated phases: carboxylation, reduction, and regeneration.
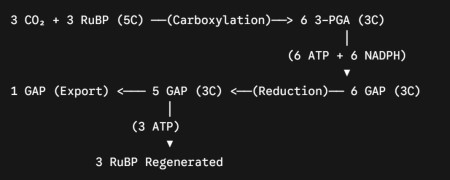
In the carboxylation phase, the 5-carbon acceptor molecule ribulose-1,5-bisphosphate (RuBP) combines with CO₂ to yield two molecules of 3-carbon 3-phosphoglyceric acid (3-PGA). This step is catalyzed by the enzyme ribulose bisphosphate carboxylase/oxygenase (Rubisco).
During reduction, 3-PGA is converted into glyceraldehyde-3-phosphate (GAP, or triose phosphate) using ATP-derived phosphate and electrons supplied by NADPH. This phase regenerates ADP and NADP⁺ for reuse in light reactions.
While a portion of synthesized GAP is exported for starch and sucrose biosynthesis, the remaining GAP enters the regeneration phase to reconstitute RuBP via additional ATP consumption. Three complete turns of the Calvin cycle fix three CO₂ molecules, yielding a net output of one GAP molecule. Fixing each CO₂ molecule requires two NADPH and three ATP.
Comparative Biochemistry: C₃, C₄, and CAM Pathways. Certain plant lineages (such as maize, sugarcane, and tropical grasses) have evolved the C₄ photosynthetic pathway, fixing CO₂ into 4-carbon dicarboxylic acids (malate and aspartate) rather than 3-PGA. In C₄ plants, atmospheric CO₂ is initially bound to phosphoenolpyruvate (PEP) by PEP carboxylase to form oxaloacetate, which is subsequently converted into malate or aspartate. These 4-carbon acids are transported to specialized bundle-sheath cells and decarboxylated to release CO₂ directly to Rubisco for entry into the Calvin cycle, while the remaining pyruvate is shuttled back to mesophyll cells to regenerate PEP via ATP consumption.
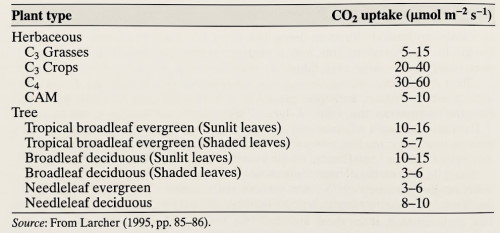
Table 16.1. Maximum net photosynthesis with natural CO₂ availability, saturated light intensity, optimal temperature, and adequate water. Source: From Larcher (1995, pp. 85–86).
This structural spatial separation concentrates CO₂ around Rubisco, effectively suppressing photorespiration. Photorespiration occurs in C₃ plants because Rubisco exhibits dual affinity for both CO₂ and oxygen (O₂), catalyzing an oxygenation reaction that consumes energy and releases previously fixed CO₂, reducing net carbon gain by 30–50%. By eliminating photorespiration, C₄ plants achieve higher net photosynthetic rates and superior water-use efficiency under elevated irradiance and high temperatures.
Desert succulents, cacti, and epiphytes utilize Crassulacean Acid Metabolism (CAM) to adapt to hyper-arid conditions. CAM plants open stomata exclusively at night to absorb CO₂, minimizing transpirational water loss. Nighttime CO₂ is fixed by PEP carboxylase into malate and stored within central vacuoles. During daylight hours, stomata remain closed, and stored malate is decarboxylated internally to supply CO₂ to the Calvin cycle. Unlike C₄ plants, which rely on spatial separation across distinct cell types, CAM plants achieve carbon concentration through temporal separation within a single mesophyll cell.
Environmental Controls on Net Photosynthetic Rates. Net photosynthesis represents the mathematical difference between total carbon assimilation via the Calvin cycle and carbon loss through mitochondrial respiration. Respiration oxidizes stored carbohydrates according to the reverse stoichiometry:
C₆H₁₂O₆ + 6 O₂ → 6 CO₂ + 6 H₂O
The rate of respiration increases exponentially with warming temperatures.
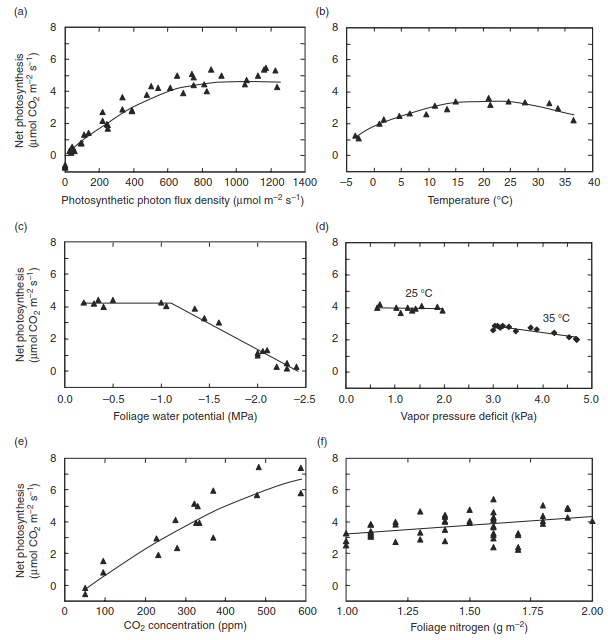
Fig. 16.3. Environmental controls of net photosynthesis for jack pine trees. Net photosynthesis is shown in response to (a) photosynthetic photon flux density, (b) temperature, (c) foliage water potential, (d) vapor pressure deficit, (e) ambient CO₂ concentration, and (f) foliage nitrogen. Data from Dang et al. (1997a,b, 1998).
As depicted in environmental control models, net carbon uptake is modulated by several key abiotic drivers:
- Photosynthetic Photon Flux Density (PPFD): Under low irradiance, respiratory CO₂ release exceeds photosynthetic uptake. The irradiance level where net carbon exchange equals zero is designated as the light compensation point (typically 20–40 µmol photon m⁻² s⁻¹). Above this threshold, assimilation increases linearly until reaching light saturation, where Rubisco activity and sub-stomatal CO₂ availability become limiting.
- Temperature: Biochemical reaction kinetics accelerate with rising temperatures up to a species-specific thermal optimum (15–25°C for typical C₃ species). Beyond this optimal range, thermal denaturation of photosynthetic enzymes and accelerated photorespiration cause net assimilation to decline sharply.
- Water Potential and Vapor Pressure Deficit (VPD): As soil moisture decreases or atmospheric VPD increases, leaf water potential drops, causing stomatal closure to prevent xylem cavitation. Stomatal closure restricts internal CO₂ diffusion, reducing net carbon gain.
- Ambient CO₂ and Foliage Nitrogen: Elevated atmospheric CO₂ saturates Rubisco carboxylation sites, reducing photorespiratory loss in C₃ plants until reaching a supply threshold dictated by RuBP regeneration capacity. Furthermore, because Rubisco and chlorophyll represent major leaf nitrogen sinks, foliage nitrogen concentration correlates directly with photosynthetic capacity.
Modeling C₃ Photosynthetic Kinetics and Carbon Assimilation
The quantitative modeling of terrestrial plant photosynthesis is crucial for understanding global primary productivity, carbon cycling, and the responses of ecosystems to environmental change. Farquhar et al. (1980) formulated a widely used model of C₃ photosynthesis, which was subsequently refined and expanded across numerous seminal plant physiology studies (see also Farquhar and von Caemmerer, 1982; von Caemmerer, 2000, 2013; von Caemmerer et al., 2009; Diaz-Espejo et al., 2012; Bernacchi et al., 2013).
This mechanistic framework represents photosynthesis based on the enzyme kinetics of ribulose-1,5-bisphosphate carboxylase-oxygenase (Rubisco) and the regeneration of ribulose-1,5-bisphosphate (RuBP) in response to the supply of adenosine triphosphate (ATP) and nicotinamide adenine dinucleotide phosphate (NADPH) produced in light-dependent reactions. In this model, net photosynthetic carbon assimilation (Aₙ) is governed by the minimum of biochemical limiting rates.
Comparative Photosynthetic Pathways and Biochemical Strategies. Plant species adapt to varying light, temperature, and moisture conditions through distinct biochemical mechanisms. While C₃ photosynthesis relies on Rubisco as the sole primary carboxylating enzyme, C₄ plants and Crassulacean Acid Metabolism (CAM) plants utilize phosphoenolpyruvate carboxylase (PEP carboxylase) to concentrate carbon dioxide.
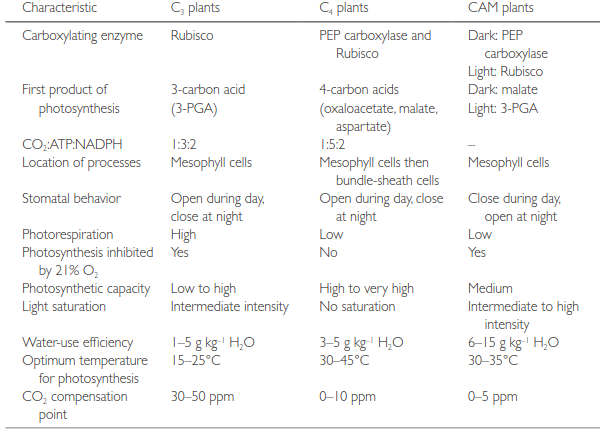
Table 16.2. Photosynthetic characteristics of C₃, C₄, and CAM plants. Source: Adapted from Larcher (1995).
Mathematical Formulation of Biochemical Rate Limits. In the Farquhar, von Caemmerer, and Berry (FVCB) framework, net photosynthetic assimilation rate (Aₙ, μmol CO₂ m⁻² s⁻¹) is expressed as the lesser of two or three limiting rates minus mitochondrial respiration (R_d, μmol CO₂ m⁻² s⁻¹) occurring in the light:

Where A_c is the Rubisco-limited rate of photosynthesis and A_j is the light-limited rate allowed by RuBP regeneration.
Rubisco-Limited Rate (A_c). The Rubisco-limited carboxylation rate is specified in relation to the maximum rate of carboxylation (V_cmax, μmol m⁻² s⁻¹) according to Michaelis-Menten kinetics:

Where:
- c_i is the intercellular CO₂ concentration (μmol mol⁻¹) at the site of CO₂ fixation in the chloroplast.
- Γ* is the CO₂ compensation point in the absence of day respiration (μmol mol⁻¹).
- o_i is the oxygen concentration in the mesophyll (equal to ambient air, 209 mmol mol⁻¹).
- K_c (μmol mol⁻¹) and K_o (mmol mol⁻¹) represent the Michaelis-Menten constants for the carboxylation and oxygenation reactions of Rubisco, respectively.
The parameters Γ*, K_c, and K_o exhibit strong temperature dependencies. Typical reference values determined at 25°C by Bernacchi et al. (2001) are Γ* = 42.75 μmol mol⁻¹, K_c = 404.9 μmol mol⁻¹, and K_o = 278.4 mmol mol⁻¹.
RuBP-Limited Rate (A_j). The RuBP-limited rate of photosynthesis is dictated by the rate of photosynthetic electron transport (J, μmol m⁻² s⁻¹):

The electron transport rate (J) depends on the photosynthetically active radiation (PAR) absorbed by the leaf. It is expressed mathematically as the smaller non-rectangular hyperbolic root of:

Where J_max is the maximum potential rate of electron transport (μmol m⁻² s⁻¹), I_PSII represents the effective light energy utilized by Photosystem II (PSII) (μmol m⁻² s⁻¹), and Θ_J is a empirical curvature parameter.
The light utilized in electron transport varies with incident radiation (I↓, μmol photon m⁻² s⁻¹) as:

Here, α_l represents total leaf absorptance (typically ~0.8), Φ_PSII is the quantum yield of Photosystem II (mol mol⁻¹), and the factor 0.5 accounts for equal photon allocation between the two photosystems. Suggested values include Θ_J = 0.7 and Φ_PSII = 0.85 (von Caemmerer, 2000; von Caemmerer et al., 2009), though variations such as Θ_J = 0.9 have been proposed (Medlyn et al., 2002).
Triose Phosphate Utilization (TPU) Limited Rate (A_p). Subsequent updates to the model incorporated a third potential metabolic constraint: the capacity to utilize the primary products of photosynthesis (triose phosphate) in the synthesis of sucrose and starch (von Caemmerer, 2000; Diaz-Espejo et al., 2012; Bernacchi et al., 2013). In its simplest form, the product-limited rate (A_p) is given by:

Where T_p is the triose phosphate utilization rate (μmol m⁻² s⁻¹).
Photosynthetic Responses to Light and Intercellular CO₂. The interaction among A_c, A_j, and A_p governs the overall non-linear shape of photosynthetic light and CO₂ response curves.
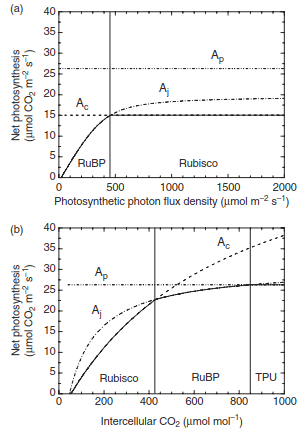
Fig. 16.4. Idealized photosynthetic response to (a) light and (b) c_i. Shown are the Rubisco-, RuBP-, and product-limited rates and the actual rate taken as the minimum of the three rates. In this example, V_cmax = 70, J_max = 130, T_p = 9.1, and R_d = 1 μmol m⁻² s⁻¹.
Figure 16.4a illustrates photosynthetic light-response curves using typical kinetic parameter values. Below saturation irradiance, light availability limits electron transport, and net photosynthesis follows the RuBP-limited rate (A_j). As photon flux density increases, photosynthesis rises until the capacity of Rubisco becomes limiting (A_c).
Figure 16.4b demonstrates the A_n-c_i response curve under saturating light. At low c_i, the concentration of CO₂ limits carboxylation, making Rubisco capacity the dominant constraint. As c_i increases, RuBP regeneration (A_j) becomes the primary limiting factor, causing the slope (dA_n / dc_i) to flatten. At high elevated CO₂ levels, triose phosphate utilization capacity (A_p) can impose an absolute upper ceiling on assimilation.
Variation and Coordination of Kinetic Parameters Across Species. Key physiological parameters—V_cmax, J_max, and R_d—exhibit substantial variance across terrestrial plant functional types and temperature regimes (Kattge et al., 2009).
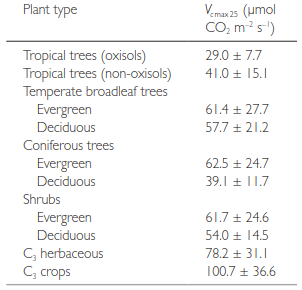
Table 16.3. V_cmax (at 25°C) estimated for C₃ plants from leaf trait databases. Note: Shown are the mean for various plant functional types ± one standard deviation. Source: Kattge et al. (2009).
High values of V_cmax directly correlate with elevated leaf nitrogen investment. Because Rubisco and chlorophyll demand significant nitrogen resources, plants balance their biochemical investments to optimize light capture and enzymatic capacity.
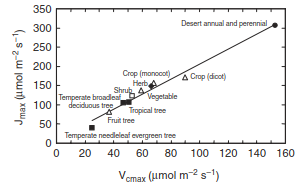
Fig. 16.5. Relationship between maximum rate of carboxylation (V_cmax) and maximum potential rate of electron transport (J_max) for 109 C₃ species. Data are shown as averages for broad groups of species. Original data for all 109 species show a similar relationship. Data from Wullschleger (1993).
Across 109 C₃ plant species evaluated by Wullschleger (1993), estimates of V_cmax range from ~6 μmol m⁻² s⁻¹ in broadleaf trees to over 194 μmol m⁻² s⁻¹ in agricultural crops. Empirical evidence indicates a strong linear scaling coupling between electron transport capacity and carboxylation capacity:
J_max = 1.67 × V_cmax (at 25°C; Medlyn et al., 2002)
This tight correlation reflects an optimal allocation of leaf nitrogen to balance enzymatic Rubisco activity with light-harvesting capacity (chlorophyll). Despite the global reliance on photosynthetic models in Earth system science, V_cmax remains a critical yet poorly constrained parameter requiring systematic field measurements (Rogers, 2014).
Date added: 2026-09-24; views: 1;