
Diffusion Dynamics and Environmental Control of Stomatal Conductance
For photosynthesis to occur, carbon dioxide (CO₂) must diffuse into the leaf matrix to reach the chloroplasts, where it is fixed and converted into carbohydrates. Leaves feature a protective, waxy cuticle on their surface that restricts arbitrary gas diffusion. Instead, CO₂ enters through microscopic epidermal openings known as stomata (Hetherington and Woodward, 2003). Individual stomatal pores typically measure 10–80 μm in length with a maximum width of approximately 5 μm. Depending on species and environmental exposure, a leaf may contain anywhere from 5 to 1,000 stomata per square millimeter of leaf surface, constituting a total pore area of less than 1–5 percent of the overall leaf area.
Stomatal conductance for CO₂ and water vapor is directly proportional to pore width, with the maximum physical opening determining the upper threshold for gas exchange. By dynamically adjusting stomatal pore width, plants regulate the balance between carbon uptake and water loss. Stomata open to allow CO₂ assimilation during active photosynthesis and close to prevent desiccation via transpiration.
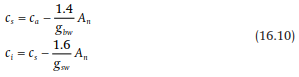
Mathematical Formulation of Diffusive Pathways. The rate of leaf net photosynthesis (Aₙ) can be modeled quantitatively as a multi-stage diffusional process governed by physical gradient principles:

In these equations:
- c_a, c_s, and c_i represent the ambient, leaf surface, and intercellular CO₂ concentrations (μmol mol⁻¹), respectively.
- g_bw and g_sw represent the boundary layer conductance and stomatal conductance to water vapor diffusion (mol H₂O m⁻² s⁻¹), respectively.
The constant numerical factors 1.4 and 1.6 account for the lower diffusivity of CO₂ compared to H₂O in air. Specifically, the factor 1.4 adjusts boundary layer conductance for H₂O to CO₂ (g_bc = g_bw / 1.4), while 1.6 adjusts stomatal conductance for H₂O to CO₂ (g_sc = g_sw / 1.6).
Resistance Networks and Gradient Equations. The first equality describes the flux of CO₂ from the ambient atmosphere across the leaf boundary layer to the leaf surface. The second equality models diffusion from the leaf surface through the stomatal aperture into the intercellular air space. The final equality combines these components into total leaf conductance (g_l), expressed as:
g_l = 1 / (1.4 × g_bw⁻¹ + 1.6 × g_sw⁻¹)
Diffusion requires a descending concentration gradient such that c_a > c_s > c_i. Rearranging these relationships yields the concentration drop across each interface:
Mesophyll Conductance and Chloroplastic CO₂ Concentrations. While basic models assume the CO₂ concentration inside the chloroplast (c_c) equals the intercellular CO₂ concentration (c_i), physical transport across the mesophyll cell wall, plasma membrane, cytosol, and chloroplast envelope imposes additional resistance. To account for this, an additional conductance parameter—mesophyll conductance (g_m)—is integrated:
c_c = c_i - Aₙ / g_m
As demonstrated in recent plant physiology literature (Flexas et al., 2008, 2012; Diaz-Espejo et al., 2012; von Caemmerer, 2013), c_c and c_i are equivalent only if mesophyll conductance is infinitely large. In living tissue, g_m is finite and of similar magnitude to stomatal conductance, making c_c strictly smaller than c_i (c_c < c_i). The physiological role of mesophyll conductance in limiting photosynthetic efficiency remains a prominent focus of eco-physiological research.
Environmental Drivers of Stomatal Responses. Stomata respond dynamically to environmental drivers to optimize gas exchange. Excluding species exhibiting Crassulacean Acid Metabolism (CAM), stomata open in response to light and close in darkness.
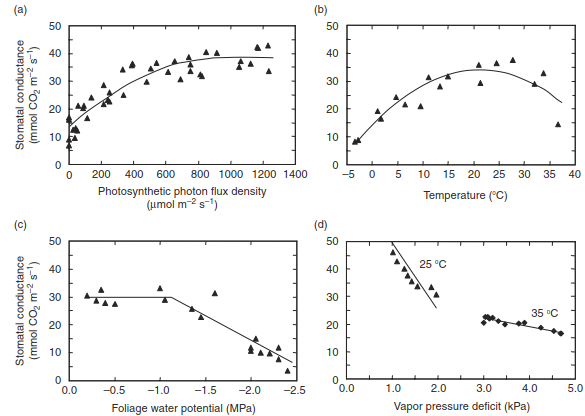
Fig. 16.6. Environmental controls of stomatal conductance for jack pine. Stomatal conductance is shown in response to (a) photosynthetic photon flux density, (b) temperature, (c) foliage water potential, and (d) vapor pressure deficit. Data from Dang et al. (1997a,b, 1998).
As illustrated in Figure 16.6, several primary abiotic factors regulate stomatal conductance (g_sw):
1. Photosynthetic Photon Flux Density (PPFD): Conductance increases hyperbolically with light intensity up to saturation levels (Fig. 16.6a).
2. Temperature: Conductance exhibits a parabolic response, reaching an optimum peak and declining at non-optimal thermal regimes (Fig. 16.6b).
3. Foliage Water Potential (Ψ): As foliage water potential declines due to transpiration exceeding root water uptake, stomata close to prevent catastrophic xylem cavitation (Fig. 16.6c).
4. Vapor Pressure Deficit (VPD): Increasing atmospheric vapor pressure deficit enhances the evaporative gradient, prompting stomatal closure to minimize excessive water loss (Fig. 16.6d).
Empirical Modeling of Stomatal Behavior. To capture these environmental interactions, Jarvis (1976) developed an empirical formulation where individual environmental stress functions scale baseline conductance:

In this formulation, g_sw(I↓) represents stomatal conductance as a function of photosynthetically active radiation. The modifier functions f₁(T), f₂(D), f₃(Ψ), and f₄(c_a) are empirical functions scaled from zero to one that adjust conductance for temperature, vapor pressure deficit, foliage water potential, and ambient CO₂ concentration, respectively.
This multiplicative framework by Jarvis (1976) has been widely implemented to represent stomatal conductance within global land surface models and Earth system climate simulations (Dickinson et al., 1986, 1993; Sellers et al., 1986).
Stomatal Conductance & Photosynthesis: Physiological Models
Introduction to Stomatal Physiology and Gas Exchange Mechanisms. Subsequent models of stomatal conductance were developed from a more mechanistic understanding of stomatal physiology. The physiology of stomata represents an evolutionary compromise between two conflicting functional goals: permitting CO₂ uptake during photosynthesis while simultaneously restricting water loss during transpiration (Cowan, 1977; Cowan and Farquhar, 1977). When stomata open, water vapor diffuses out of the leaf through the exact same physical pathway through which carbon dioxide diffuses into the intercellular leaf space.
The concentration gradient driving water vapor loss (~1000–3000 Pa, or 0.01–0.03 mol mol⁻¹) is approximately 100 times greater than the concentration gradient governing CO₂ diffusion (~30 Pa, or 300 µmol mol⁻¹). Consequently, a large amount of transpiration water loss inevitably accompanies photosynthetic carbon assimilation. C₃ plants, in particular, must allow for substantial rates of CO₂ diffusion because the primary photosynthetic enzyme, Rubisco, exhibits a relatively low affinity for CO₂, leading to significant transpiration losses under typical atmospheric conditions.
Physiological Optimization of CO₂ Gain and Water Loss. Stomata are tightly regulated to maximize CO₂ gain while minimizing transpiration water loss. This optimization strategy is clearly evident from empirical experiments relating stomatal conductance to photosynthetic rate. Plants grown under a variety of environmental irradiances, nutrient concentrations, ambient CO₂ concentrations, and leaf water potentials exhibit large variation in photosynthetic rate and stomatal conductance. However, photosynthesis and stomatal conductance vary in a near-constant proportion under a given set of environmental conditions (Wong et al., 1978, 1979, 1985a–c).
Empirical measurements of photosynthesis and stomatal conductance in jack pine trees (Pinus banksiana) illustrate these fundamental biological relationships. Across a broad spectrum of irradiance and foliage water potential—ranging from full illumination to complete darkness, and from moist soils to severely desiccated conditions—photosynthesis increases proportionally with increases in stomatal conductance (Figure 16.7). Simultaneously, total transpiration increases proportionally with greater conductance.
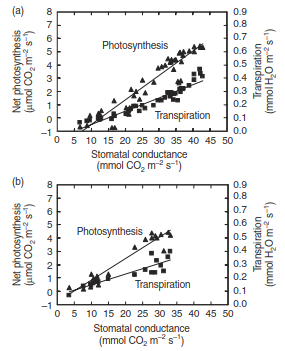
Fig. 16.7 Relationship between photosynthesis, transpiration, and stomatal conductance for jack pine. (a) Light response over a range of 0 to 1250 µmol photon m⁻² s⁻¹. (b) Foliage water potential response over a range of −0.2 to −2.4 MPa. Data from Dang et al. (1997a,b, 1998).
Ecosystem-Scale Dynamics and Cross-Species Patterns. Physiological measurements across diverse terrestrial plant communities demonstrate a strong positive correlation between maximum stomatal conductance and the maximum rate of photosynthesis (Field and Mooney, 1986; Körner, 1994; Hetherington and Woodward, 2003). Figure 16.8 illustrates these macrosystemic relationships, where maximum rates of photosynthetic carbon assimilation systematically scale upward as stomatal conductance increases across ecological functional groups.
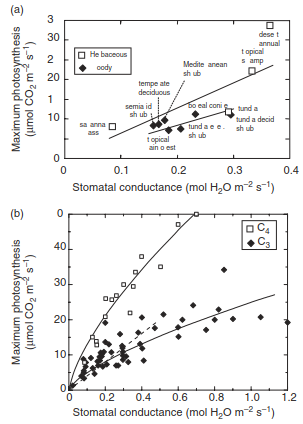
Fig. 16.8 Relationship between maximum photosynthesis and stomatal conductance. (a) Data shown are mean values for 7 types of woody vegetation and 4 types of herbaceous vegetation. The regression equations shown with these data are based on the full dataset of 55 woody plants and 18 herbaceous plants. Data from Körner (1994). (b) Data shown are for C₃ and C₄ plants (Hetherington and Woodward 2003). The dashed line for C₃ plants shows the regression through the origin for stomatal conductance less than 0.5 mol m⁻² s⁻¹, comparable to panel (a).
Coherent changes in photosynthetic carbon metabolism and stomatal behavior demonstrate that biochemical capacity and physical gas exchange change in tight coordination. Stomatal conductance varies to match the photosynthetic capacity of leaves in order to optimize overall leaf gas exchange—effectively minimizing transpirational water loss while permitting necessary photosynthetic CO₂ gain relative to the prevailing microclimate.
Mathematical Formulations of Leaf Diffusion and Intercellular CO₂. Plants achieve this regulatory control by adjusting stomatal conductance to maintain intercellular CO₂ concentration (cᵢ) as a nearly constant fraction of ambient CO₂ concentration (cₐ), keeping the cᵢ / cₐ ratio remarkably stable for particular environmental regimes.
This mechanism is mathematically described using the standard physical diffusion equation. Because boundary layer conductance (~1–4 mol m⁻² s⁻¹) is typically tenfold greater than stomatal conductance (~0.1–0.4 mol m⁻² s⁻¹), boundary layer resistance can be neglected, allowing the net photosynthetic assimilation rate (Aₙ) to be approximated as:
Aₙ = (gₛw / 1.6) × (cₐ − cᵢ) = (gₛw / 1.6) × cₐ × (1 − cᵢ / cₐ)
Here, the variable gₛw represents the stomatal conductance to water vapor, and the term 1 − cᵢ / cₐ represents the relative CO₂ diffusion gradient for a given ambient CO₂ concentration (cₐ). The constant 1.6 accounts for the relative ratio of the binary diffusion coefficients of water vapor versus carbon dioxide in air.
Rearranging this formula allows for calculating stomatal conductance directly as a function of net photosynthetic rate:
gₛw = (1.6 × Aₙ) / [cₐ × (1 − cᵢ / cₐ)]
Comparative Analysis of C₃ and C₄ Photosynthetic Pathways
A linear relationship between net photosynthesis (Aₙ) and stomatal conductance (gₛw) at a constant ambient CO₂ concentration (cₐ) directly implies a constant cᵢ / cₐ ratio. However, C₄ plants exhibit fundamentally different biochemical kinetics compared to C₃ plants, possessing significantly higher rates of photosynthesis for any given stomatal conductance (Figure 16.8b).
Because C₄ plants utilize PEP carboxylase for initial carbon fixation—an enzyme with a vastly higher affinity for bicarbonate and no oxygenase activity—they maintain a lower intercellular CO₂ concentration (cᵢ). Consequently, the typical cᵢ / cₐ ratio ranges between approximately 0.65 to 0.80 for C₃ plants, whereas it drops to between 0.40 to 0.60 for C₄ plants (Hetherington and Woodward, 2003).
This tight coupling between photosynthesis and stomatal conductance to maintain a constant cᵢ / cₐ ratio represents a highly coordinated, evolutionarily optimized physiological response that enables plants to balance carbon acquisition against water conservation across varying terrestrial environments.
Date added: 2026-09-24; views: 1;