
Stomatal Conductance and Water-Use Efficiency Modeling
The intricate physiological relationship existing between stomatal conductance and photosynthetic rate indicates that incorporating advanced biochemical models of photosynthesis significantly enhances the predictive accuracy of leaf gas exchange mechanisms. Collatz et al. (1991) formalized these fundamental principles into an empirical model tailored for C₃ plants, directly bridging the gap between the internal biochemistry of photosynthesis and the biophysical processes of carbon dioxide diffusion. Their formulation coupled the landmark Farquhar et al. (1980) photosynthesis model with the empirical Ball–Berry stomatal conductance model initially introduced by Ball et al. (1987).
The empirical Ball–Berry model represents an operational extension of fundamental gas exchange equations, explicitly linking stomatal performance directly to net photosynthesis:

Where:
· h_s represents the fractional relative humidity evaluated directly at the leaf surface (dimensionless quantity).
· c_s denotes the leaf surface CO₂ concentration expressed in µmol mol⁻¹.
· g₁ is a empirical parameter representing the slope of the functional relationship.
· g₀ defines the minimum stomatal conductance when net assimilation drops to zero.
· A_n signifies net photosynthesis expressed in units of µmol CO₂ m⁻² s⁻¹.
· g_sw and g₀ are quantified using units of mol H₂O m⁻² s⁻¹.
Subsequent theoretical developments by Collatz et al. (1992) extended this empirical framework to construct an equivalent predictive model tailored to C₄ plants. Across typical physiological conditions, representative empirical parameters for baseline C₃ plants are set to g₁ = 9 and g₀ = 0.01 mol H₂O m⁻² s⁻¹, although these empirical values demonstrate substantial variation across diverse functional plant species, as demonstrated by Medlyn et al. (2011).
Numerical Coupled Systems and Global Earth System Modeling. When determining net photosynthetic output (A_n), the Ball–Berry equation can be calculated directly to determine effective stomatal conductance. However, solving this coupled mathematical system describing concurrent photosynthetic processes and gas transport requires simultaneous knowledge of the intercellular CO₂ concentration (c_i) as well as the leaf surface CO₂ concentration (c_s). These concentrations are derived using gas diffusion principles.
A parallel physical diffusion network is implemented to solve for the exact leaf surface humidity (h_s). Because these parameters are tightly coupled, finding a complete solution requires complex numerical, iterative algorithms that cycle until both A_n and g_sw reach mathematical convergence.
· Implementation in Earth System Models: This integrated iterative framework was incorporated into global land surface models during the mid-1990s by Bonan (1995), Sellers et al. (1996), and Cox et al. (1999).
· Atmospheric & Biospheric Coupling: Incorporating these coupled schemes allowed dynamic simulations of terrestrial carbon uptake (Bonan 1995; Denning et al. 1995, 1996; Craig et al. 1998).
· Vapor Pressure Deficit Variations: Modern structural variants often substitute leaf surface relative humidity with direct functional dependencies on atmospheric vapor pressure deficit (VPD or D) (Leuning 1995; Medlyn et al. 2011).
Stomatal Response to Drought and Soil Moisture Stress. Although the original Ball–Berry stomatal model relies on empirical correlations from extensive leaf gas exchange measurements under well-watered conditions, capturing plant responses under progressive soil moisture stress remains a challenge in plant eco-physiology. Under ideal conditions with high soil moisture, stomatal conductance scales predictably with the ratio of carbon assimilation to surface atmospheric CO₂ concentration. However, establishing an accurate representation of stomatal closure during severe drought stress presents distinct modeling challenges.
To account for soil water deficits, existing modeling frameworks generally apply one of two primary approaches:
1. Direct Diffusive Constraints: Some models directly impose physical transport limitations by reducing the slope parameter (g₁) as a function of declining soil water potential.
2. Indirect Biochemical Constraints: Alternative frameworks apply biochemical limitations directly, decreasing maximum carboxylation rates and thereby reducing net assimilation (A_n), which indirectly forces stomatal closure.
Comparative research by Egea et al. (2011) and De Kauwe et al. (2013) indicates that neither approach fully captures real-world stomatal responses to drought. Empirical evidence compiled by Zhou et al. (2013) demonstrates that accurate land surface representations require incorporating both diffusive and biochemical stress factors simultaneously. Furthermore, significant model uncertainty persists regarding the functional mathematical form of the soil moisture stress response (Verhoef and Egea 2014).
Physiological Optimization and Water-Use Efficiency. Although derived empirically, Ball–Berry style models can be theoretically grounded using the physiological assumption that plants adjust stomatal aperture to maximize net carbon gain while minimizing transpirational water loss (Katul et al. 2010; Medlyn et al. 2011).
Water-use efficiency (WUE) is defined as the ratio of photosynthetic carbon gain to transpirational water loss. At the single-leaf scale, this is expressed as:

Where:
· E represents transpiration rate (mol H₂O m⁻² s⁻¹).
· D denotes vapor pressure deficit expressed as D = (e_i - e_a) / P (mol mol⁻¹).
· c_a is atmospheric CO₂ concentration.
· c_i is intercellular CO₂ concentration.
This equation defines instantaneous water-use efficiency. It highlights how local atmospheric conditions—specifically ambient temperature and relative humidity—exert strong physical control over leaf transpiration rates through changes in vapor pressure deficit.
Alternatively, the purely biological component of water-use efficiency, independent of immediate atmospheric evaporative demand, is represented by the ratio of photosynthesis to stomatal conductance:

This formulation is known as the intrinsic water-use efficiency (or inherent water-use efficiency). It adjusts instantaneous WUE measurements to isolate biological stomatal regulation from variations in atmospheric vapor pressure deficit.
The two metrics are related by:
A_n / g_sw = D · (A_n / E)
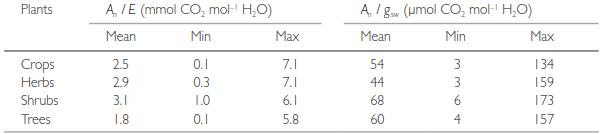
Table 16.4. Instantaneous water-use efficiency (A_n / E) and intrinsic water-use efficiency (A_n / g_sw) for various plant functional groups. Source: Adapted from Medrano et al. (2012).
As shown in Table 16.4, values reported across empirical studies range from 0.1 to 7 mmol CO₂ mol⁻¹ H₂O for instantaneous water-use efficiency, and from 3 to 173 µmol CO₂ mol⁻¹ H₂O for intrinsic water-use efficiency across plant groups.
Evolutionary Stomatal Optimization Theory. The underlying evolutionary framework for stomatal behavior was pioneered by Cowan (1977) and Cowan and Farquhar (1977). They proposed that stomatal control evolved to minimize total transpiration water loss (E) for a given gain of carbon (A_n) over time.
This optimization hypothesis assumes that stomatal conductance continuously adjusts to keep the marginal water cost of carbon gain (∂E / ∂A_n) constant over time, or equivalently, maintains a constant marginal carbon gain per unit of transpired water (∂A_n / ∂E).
Mathematical expressions for stomatal conductance can be derived directly from this optimization principle when coupled with the biochemical photosynthesis model of Farquhar et al. (1980). However, these formulations vary depending on whether photosynthetic rates are currently limited by Rubisco activity, RuBP regeneration, or co-limitation states. Each state yields distinct stomatal sensitivities to changing atmospheric CO₂ levels (Arneth et al. 2002; Katul et al. 2010; Medlyn et al. 2011, 2013; Vico et al. 2013).
Although the empirical Ball–Berry model was not originally constructed as an explicit optimization model, its predictions align closely with analytical optimality theory. However, unified water-use efficiency optimization models derive a functional relationship where stomatal conductance scales proportionally with D⁻¹/² rather than linearly with relative surface humidity h_s (Katul et al. 2009; Medlyn et al. 2011), offering refined precision for global climate and ecosystem predictions.
Stomatal Regulation and Carbon Isotope Discrimination Under Elevated CO₂
1. Isotopic Discrimination during Photosynthesis. The process of terrestrial photosynthesis systematically discriminates against the heavier stable carbon isotope, ¹³CO₂, relative to the lighter, more abundant ¹²CO₂. Consequently, synthesized photoassimilates and overall plant biomass are characteristically depleted in ¹³C compared to the surrounding atmosphere (Farquhar et al., 1982; Brugnoli et al., 2012).
This isotopic fractionation originates primarily from two physical and enzymatic checkpoints:
1. Diffusive Fractionation: Gas phase diffusion through open stomatal pores favors ¹²CO₂ over ¹³CO₂ due to slight differences in binary diffusion coefficients, generating a minor discrimination factor (a ≈ 4.4‰).
2. Enzymatic Fractionation: The Rubisco (ribulose-1,5-bisphosphate carboxylase/oxygenase) enzyme strongly discriminates against ¹³CO₂ during primary carboxylation, yielding a much larger fractionation factor (b ≈ 28‰ to 30‰).
The isotopic composition of plant material is quantitatively expressed via the delta notation (δ¹³C), representing the ratio of ¹³C/¹²C in a given sample (R_sample) relative to an international standard (R_standard, typically Vienna Pee Dee Belemnite):

Values of δ¹³C are reported in per mil (‰). Ambient atmospheric CO₂ exhibits a δ¹³C value of approximately -8‰. Plants operating under the C₃ photosynthetic pathway exhibit δ¹³C values ranging from approximately -22‰ to -34‰. By contrast, C₄ plants, which utilize PEP carboxylase for initial carbon capture, display significantly smaller fractionation, with δ¹³C values spanning -9‰ to -16‰.
To quantify the net shift in isotopic relative abundance between air (R_air) and plant biomass (R_plant), photosynthetic isotopic discrimination (Δ) is defined as:

Alternatively, Δ can be calculated directly using the delta values of air and plant tissue:

In C₃ species, Δ is fundamentally dictated by the balance between intercellular boundary layer diffusion and enzymatic carboxylation within the mesophyll. Expressed in terms of the ratio of intercellular to ambient CO₂ concentration (cᵢ / cₐ):
· When cᵢ / cₐ is small (e.g., under severe drought or stomatal closure), discrimination by Rubisco is restricted, and the diffusive term (Δ = 4.4‰) dominates.
· When cᵢ / cₐ is large, carboxylative fractionation by Rubisco (Δ ≈ 30‰) dominates the expression.
A linear approximation linking these dynamics is expressed as:

Because intrinsic water-use efficiency (WUE) scales inversely with cᵢ / cₐ, reductions in cᵢ / cₐ lead to corresponding declines in Δ. Consequently, stable carbon isotope ratios serve as an exceptionally reliable long-term integrator of plant water-use efficiency (Farquhar et al., 1982; Brugnoli et al., 2012; Medrano et al., 2012).
2. Stomatal Dynamics and Atmospheric CO₂ Variability. Atmospheric CO₂ levels have fluctuated dramatically across geological epochs (Franks et al., 2013, 2014). A defining global feature of the modern era is the rapid increase in atmospheric CO₂ concentration driven by industrial emissions. Plants respond to elevated CO₂ (eCO₂) through rapid physiological adjustments as well as long-term structural and anatomical adaptations.
A primary physiological baseline across diverse terrestrial plant functional types is that elevated atmospheric CO₂ enhances net assimilation rates while simultaneously decreasing stomatal conductance (gₛ). This mechanism maintains a relatively constant cᵢ / cₐ ratio, maximizing overall water-use efficiency.
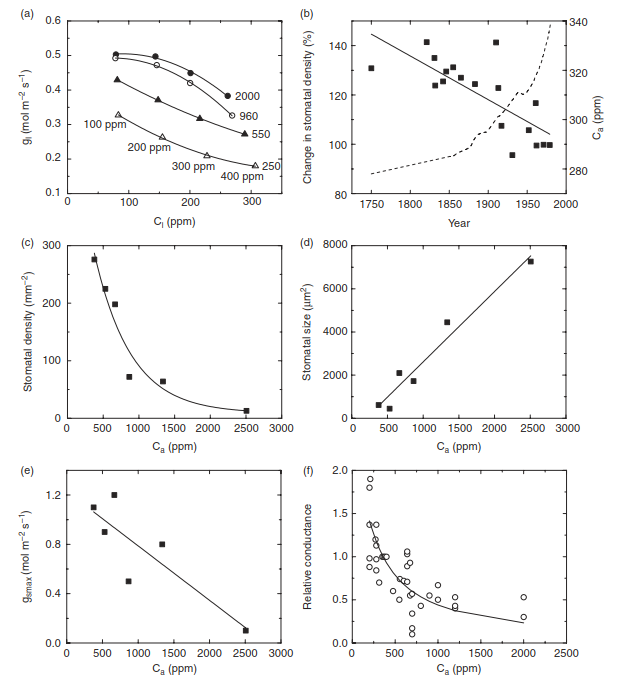
Fig. 16.9. Stomatal response to atmospheric CO₂ at various timescales. (a) Leaf conductance for Eucalyptus pauciflora in relation to short-term (< 1 hour) variation in CO₂ at four different irradiances (250, 550, 960, and 2000 µmol m⁻² s⁻¹). Stomatal response is in relation to cᵢ. Shown also is ambient CO₂, which ranged from 100 to 400 ppm. Adapted from Wong et al. (1978). (b) Relative change in stomatal density in herbarium specimens of seven species of temperate trees and one species of shrub over the past 200 years. Also shown is the atmospheric CO₂ trend (dashed line). Adapted from Woodward (1987). (c–e) Stomatal density, size, and maximum conductance in response to atmospheric CO₂ concentration over the past 400 million years. Adapted from Franks et al. (2013). See also Franks and Beerling (2009). (f) Relative stomatal conductance in relation to the ambient CO₂ concentration. The solid line is the predicted relationship from Eq. (16.23). Data are from Franks et al. (2013).
Short-term exposure experiments show immediate stomatal closure under high CO₂. As shown in Eucalyptus pauciflora (Wong et al., 1978), conductance drops sharply as intercellular CO₂ increases, with the magnitude of response governed by photosynthetically active radiation (Fig. 16.9a).
3. Responses Observed in Free-Air CO₂ Enrichment (FACE) Experiments. To move beyond pot-bound growth chamber artifacts, Free-Air CO₂ Enrichment (FACE) experiments evaluate vegetation exposed to elevated CO₂ under natural open-field environmental conditions.
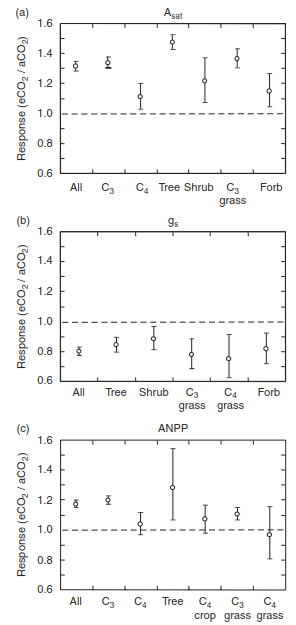
Fig. 16.10. Synthesis results from 12 FACE studies in forest, grassland, desert, and agricultural ecosystems exposed to CO₂ concentrations of 475–600 ppm. Data are the response ratio (elevated CO₂ response / ambient CO₂ response) shown as a mean (circles) and 95 percent confidence interval (bars) for all species and by plant functional type for (a) light-saturated leaf photosynthetic rate (A_sat), (b) stomatal conductance (gₛ), and (c) aboveground production (ANPP). Data from Ainsworth and Long (2005).
Meta-analyses of FACE experiments across temperate forests, grasslands, deserts, and agricultural crops (Ainsworth and Long, 2005; Nowak et al., 2004) highlight several key consensus patterns under CO₂ enrichment (475–600 ppm):
· Photosynthetic Stimulation: Light-saturated leaf photosynthesis (A_sat) increases by an average of 31% (Fig. 16.10a). C₃ plants show a strong enhancement (+34%), whereas C₄ species show lower stimulation (+11%). Trees display the largest gains, averaging a +47% increase in A_sat.
· Stomatal Conductance Reduction: Stomatal conductance (gₛ) decreases across functional groups by an average of 20% (Fig. 16.10b), substantially reducing transpiration loss.
· Biomass Production: Aboveground net primary productivity (ANPP) increases significantly across most biomes, particularly in tree stands (Fig. 16.10c).
· Biochemical Acclimation: Long-term exposure to high CO₂ often induces photosynthetic down-regulation, marked by reduced enzyme capacities for maximum carboxylation (V_cmax) and electron transport (J_max), an effect exacerbated under soil nitrogen limitations.
4. Anatomical Adaptations and Maximum Stomatal Conductance. Beyond rapid guard-cell turgor adjustments, plants regulate gas exchange over decadal, centennial, and geological timescales by altering stomatal anatomy.
Historical herbarium records over the past two centuries reveal a persistent decline in stomatal density (stomata per unit leaf area) in response to rising industrial CO₂ levels (Woodward, 1987; Fig. 16.9b). Fossilized leaf records extending across 400 million years show coordinated anatomical shifts: periods of high paleo-CO₂ correlate with lower stomatal densities and larger individual stomata (Franks and Beerling, 2009; Franks et al., 2013; Fig. 16.9c–e).
Anatomical maximum stomatal conductance (g_smax, in mol H₂O m⁻² s⁻¹) is theoretically constrained by stomatal geometry:

Where:
· nₛ = Stomatal density (stomata m⁻²)
· a_max = Maximum pore area when fully opened (m²)
· l = Stomatal pore depth (m)
· D_w = Diffusivity of water vapor in air (24.0 × 10⁻⁶ m² s⁻¹ at 15°C)
· ρ_m = Molar volume of air (42.3 mol m⁻³ at 15°C)
For example, in Arabidopsis thaliana (Dow et al., 2014), adaxial surface traits (nₛ = 80 mm⁻², a_max = 71.2 µm², l = 5.0 µm) yield g_smax = 0.46 mol m⁻² s⁻¹, while abaxial traits (nₛ = 105 mm⁻², a_max = 72.1 µm², l = 5.4 µm) yield g_smax = 0.59 mol m⁻² s⁻¹, totaling 1.05 mol m⁻² s⁻¹.
In practical ecological settings, operational diffusive conductance (g_sw) operates below g_smax, but scales directly with this anatomical threshold. Analysis of flora over 150-year shifts demonstrates up to a 34% reduction in g_smax driven by elevated CO₂ (Lammertsma et al., 2011).
5. Evolutionary Dynamics and Unified Analytical Models. Systematic variations in g_smax reflect foundational evolutionary trade-offs in leaf hydraulics and carbon uptake. Angiosperms generally feature high stomatal densities, small pore sizes, and high leaf vein length densities, supporting elevated hydraulic conductance and high g_smax (BODRIBB et al., 2005, 2007). This specialized hydraulic network was a major driver in the diversification of flowering plants during the Cretaceous period (~100 million years ago) as atmospheric CO₂ declined (Brodribb and Feild, 2010). By contrast, conifers rely on lower g_smax coupled with lower hydraulic transport capacities.
Across both short-term physiological responses and evolutionary shifts, stomatal regulation maintains optimized carbon gain relative to water loss. Franks et al. (2013) demonstrated that relative photosynthetic enhancement under elevated CO₂ can be modeled analytically:

Where:
· c_a0 = Reference atmospheric CO₂ concentration (360 ppm)
· Γ* = Photorespiratory CO₂ compensation point (~40 ppm)
By extending the Ball-Berry stomatal model, relative diffusive conductance (g_sw(rel)) under elevated CO₂ scales directly with photosynthetic gain (Fig. 16.9f):

Where c_a(rel) = cₐ / c_a0.
Equation (16.23) accurately captures long-term stomatal conductance declines observed across empirical studies (Fig. 16.9f). This alignment demonstrates that stomata function predictably across operational, developmental, and evolutionary timescales to optimize RuBP-limited carbon assimilation and maximize water-use efficiency (Medlyn et al., 2011, 2013).
Date added: 2026-09-24; views: 1;