
Land Use, Irrigation, and Biophysical Climate Forcing Dynamics
Biophysical Impacts of Irrigation in Arid and Semiarid Regions. Irrigation is common in arid and semiarid climates, where sufficient rainfall to grow crops is lacking. Irrigation alters the local surface energy balance by decreasing surface albedo, increasing latent heat flux, and decreasing sensible heat flux. As a result, surface temperature decreases. The large contrast in sensible heat flux and latent heat flux between irrigated croplands and surrounding semiarid vegetation can generate mesoscale circulations akin to sea breezes between the cool, wet agricultural land and the hot, dry surrounding natural vegetation (Figure 14.11).
Observational and Modeling Evidence from the Great Plains. Climate may be changing in areas with irrigation. One such region is the Great Plains of the United States, where extensive irrigated cropland is intermixed with dry grassland (Pielke et al. 2007; Mahmood et al. 2014). In Texas, observations suggest the presence of irrigation influences precipitation (Barnston and Schickedanz 1984; Moore and Rojstaczer 2002). Other observational analyses also find enhanced rainfall in the Great Plains with irrigation (DeAngelis et al. 2010). Regional climate model simulations support the notion of increased rainfall in response to irrigation (Segal et al. 1998; Harding and Snyder 2012).
Local Boundary Layer Modifications in Colorado and Beyond. Cooler surface temperatures are evident in northeastern Colorado, an area with widespread irrigated cropland among shortgrass prairie (Figure 28.16). Mesoscale atmospheric model simulations show irrigation affects the climate of northeastern Colorado (Stohlgren et al. 1998; Chase et al. 1999). Less sensible heat flux, greater latent heat flux, cooler daytime boundary layer, and more low-level moisture over irrigated areas in the plains alters atmospheric circulation between the plains and the mountains.
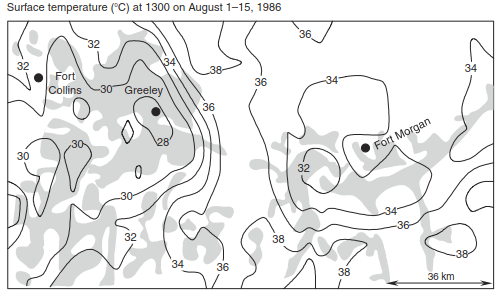
Fig. 28.16. Satellite-derived surface temperature (°C) at 1300 hours local time for the period August 1–15, 1986 for a region of northeastern Colorado near the cities of Fort Collins, Greeley, and Fort Morgan. Shading shows areas of irrigation. Adapted from Segal et al. (1988).
Regional Hydroclimatic Responses in Nebraska and California. Cooling and moistening of the boundary layer due to irrigation may have also occurred in Nebraska (Adegoke et al. 2003, 2007; Mahmood et al. 2004, 2006, 2008). Similar increases in evapotranspiration, cooling, and changes in circulation are seen with the introduction of irrigated agriculture in California (Kueppers et al. 2007; Kueppers and Snyder 2012; Sorooshian et al. 2012, 2014). Irrigation has decreased daily maximum temperature and reduced diurnal temperature range in irrigated areas of California (Lobell and Bonfils 2008).
Global Climate Modeling of Irrigation Impacts. Global climate model simulations have addressed the climatic impact of irrigation (Boucher et al. 2004; Lobell et al. 2006a,b, 2009; Sacks et al. 2009; Puma and Cook 2010; Cook et al. 2011). Such studies show regional climate influences, with cooler surface air temperature in locations of high irrigation. Irrigation is particularly prevalent in India. While global datasets of irrigated cropland are available, one of the challenges is how to model irrigation management, particularly the timing and amount of water applied (Döll and Siebert 2002).
Land Use and Land-Cover Change as a Climate Forcing. Land-cover change in middle latitudes has likely cooled the Northern Hemisphere by increasing surface albedo. The dominant cooling occurs in northern latitudes during winter and spring, when deforestation unmasks the high albedo of snow. Croplands also have a higher albedo than forests during summer, which contributes to the cooling. For example, Brovkin et al. (2006) compared the land-cover and CO₂ forcing of climate over the past millennium simulated by six different models. All models simulate planetary warming with rising atmospheric CO₂ and cooling, particularly in the Northern Hemisphere, due to land-cover change. The cooling among models of Northern Hemisphere annual mean temperature ranges from 0.2°C to 0.4°C relative to the preindustrial era. The cooling increases throughout the nineteenth century, is greatest in the early twentieth century, and decreases in the latter part of the twentieth century. This reflects trends of farmland expansion, abandonment, and reforestation in the Northern Hemisphere extratropics.
Comparative Forcing of Land-Cover vs Greenhouse Gases. In contrast, Northern Hemisphere annual mean temperature increases in all models by 0.4–0.7°C in response to CO₂. When both forcings are combined, the temperature increase is less than that expected from CO₂ alone. This suggests that observed climate warming over the industrial era may be smaller than that expected from rising atmospheric CO₂ alone.
Multi-Model Intercomparison Protocols. A subsequent analysis of seven climate models points to a similar conclusion and highlights key uncertainties in land-atmosphere feedbacks related to land-cover change, evapotranspiration, and temperature (Pitman et al. 2009; Boisier et al. 2012; de Noblet-Ducoudré et al. 2012). Four climate simulations were performed for each model to span all combinations of present-day and preindustrial greenhouse gases and present-day and preindustrial land cover. One simulation (denoted PI) was forced with conditions representative of the preindustrial era, nominally taken as 1870 with 280 ppm atmospheric CO₂, historical sea surface temperatures, and historical land cover. Another simulation (PD) was forced with present-day (1992) atmospheric CO₂ (375 ppm), sea surface temperatures, and land cover. Two additional simulations used the preindustrial forcing with present-day land cover (PIv) and the present-day forcing with preindustrial land cover (PDv). The difference PD - PDv and PIv - PI both provide estimates of the influence of historical land-cover change on climate. Regions of large change in land cover include North America and Eurasia (Figure 28.17).
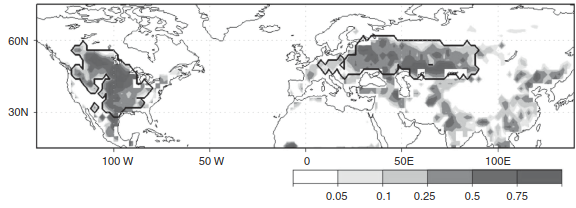
Fig. 28.17. Change in cropland and pastureland (fraction of grid cell) from the preindustrial era (1870) to present-day (1992). The two regions outlined in black denote North America and Eurasia. Reproduced from Boisier et al. (2012).
Variability in Simulated Temperature and Heat Fluxes. Most models (five) simulate cooling during the Northern Hemisphere summer in the regions of land-cover change, but the strength of the cooling varies considerably among models (Pitman et al. 2009). The temperature decrease varies from weak (< 0.5°C cooling) in some models to strong (> 1°C cooling) in others. The latent heat flux response also varies among models. Land-cover change decreases Northern Hemisphere summer latent heat flux in three models and increases latent heat flux in three models. The surface cooling is not limited to summer and occurs year-round, though with large variability among models (Figure 28.18). Historical land-cover change affects surface air temperature with a magnitude similar to (though opposite in sign) that resulting from increased greenhouse gases and a warmer ocean that occurred over the same period (de Noblet-Ducoudré et al. 2012). While these latter factors warmed temperature over North America and Eurasia by 0.5–1°C depending on season and model, land-cover change cooled temperature by 0.5°C or more in the same regions (Figure 28.18).
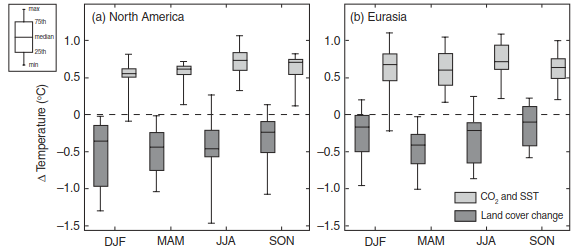
Fig. 28.18. Simulated change in surface air temperature between the preindustrial era and present-day for (a) North America and (b) Eurasia. Results are given for each of the four seasons. The top panel of each plot shows temperature changes due to greenhouse gas climate change (CO₂ and SST forcing). The bottom panel shows temperature changes due to land-cover change. Data are for seven climate models. The bottom and top of the box are the 25th and 75th percentiles, and the horizontal line within each box is the 50th percentile (the median). The whiskers (straight lines) indicate the ensemble maximum and minimum values. Adapted from de Noblet-Ducoudré et al. (2012).
Biophysical Mechanisms of Radiative and Turbulent Flux Changes. Surface cooling in temperate regions is a common response to historical land-cover change simulated by climate models. This cooling occurs from increased surface albedo with deforestation, particularly during winter when snow is on the ground. Satellite measurements show croplands, grasslands, and bare surfaces have an albedo that is more than twice that of forests during the winter when snow is on the ground (Table 26.3). Albedo differences are smaller when the ground is snow-free or in summer, but croplands and grasslands have a higher albedo than evergreen forests (by 0.08 in summer) and deciduous forests (by 0.03).
Energy Partitioning and Seasonal Radiative Shifts. The climate response to land-cover change is more complex than simply albedo-driven changes in surface radiation. One important difference among models is the partitioning of available energy between latent heat flux and sensible heat flux (Boisier et al. 2012; de Noblet-Ducoudré et al. 2012). The temperature cooling from higher surface albedo is lessened by changes in turbulent fluxes (sensible heat flux and latent heat flux) related to evapotranspiration efficiency and surface roughness that cause warming in the models (Figure 28.19). The cooling throughout the year arises from less available energy at the surface (net solar radiation plus downward longwave radiation). Less net solar radiation is the dominant term. The largest decrease in available energy is in early spring (March) because of high downwelling solar radiation combined with large changes in surface albedo due to loss of forests. The temperature cooling is 0.5°C at this time. Changes in sensible heat flux and latent heat flux produce warming, which dampens the radiative cooling.
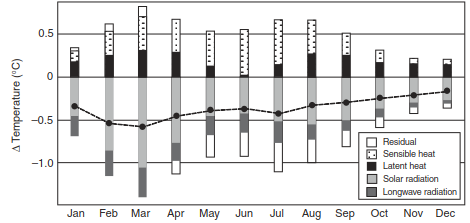
Fig. 28.19. Multi-model mean change in surface temperature due to historical land-cover change. Bars show the temperature difference arising from changes in latent heat flux, sensible heat flux, net solar radiation, downward longwave radiation, and a residual term. The dashed line shows the net surface temperature difference. Adapted from Boisier et al. (2012).
Large-Scale Atmospheric Teleconnections and Afforestation. Deforestation may have additional climate consequences. Swann et al. (2012) found that trees in northern mid-latitudes warm the Northern Hemisphere and alter global atmospheric circulation. Their climate model simulations considered large-scale afforestation (the opposite of deforestation) by replacing C₃ grasslands and croplands between 30° and 60° N with broadleaf deciduous trees. Greater tree cover decreases surface albedo, increases the absorption of solar radiation, and increases surface air temperature. The additional energy absorbed in the Northern Hemisphere produces an imbalance between the hemispheres. The Hadley circulation shifts northward to transport more energy southward across the equator, moving the intertropical convergence zone (ITCZ) northward (Figure 28.20). This alters precipitation in the tropics along the equator, with decreased rainfall in the Amazon basin.
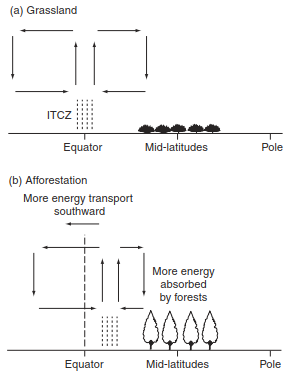
Fig. 28.20. Changes in the Hadley circulation with mid-latitude afforestation. (a) Present-day grasslands. (b) Forest expansion increases energy absorption in the Northern Hemisphere. The Hadley circulation shifts northward to transport more heat across the equator, causing the intertropical convergence zone to also migrate northwards relative to present-day grasslands. Adapted from Swann et al. (2014).
Latitude-Dependent Climatic Effects of Deforestation. Climate modeling studies generally find that temperate and boreal deforestation cools climate while tropical deforestation warms climate. The consensus is that historical land-cover change has decreased the temperature of the Northern Hemisphere and that this cooling, while small at the global scale, is regionally significant. However, there are large differences among models in their simulated climate response to land-cover change, even in a carefully controlled simulation protocol (Figure 28.18). The lack of consistency among models is due to the implementation of the land-cover change datasets in the models and the parameterization of crops, albedo, and evapotranspiration (Pitman et al. 2009; Boisier et al. 2012, 2013; de Noblet-Ducoudré et al. 2012). A broader comparison among 15 models also shows divergent temperature and evapotranspiration responses to land-cover change (Kumar et al. 2013).
Observational Fingerprints in Temperature Trends. Despite this model uncertainty, the effects of land-cover change on temperature may be emerging in the observational record. The loss of forests and increase of croplands and grasslands since preindustrial times has produced an overall cooling trend in both mean and extreme temperatures. This cooling is statistically detectable in the observed changes of warm temperature extremes and partially offsets the warming trend from greenhouse gases and other anthropogenic forcings (Christidis et al. 2013). However, the land-cover change effects are much more regional (where the land-cover change has occurred) compared with greenhouse gas warming (Pitman et al. 2012).
In Situ Comparisons of Forest and Field Temperatures. Another analysis compared air temperature measured over forests with that at nearby surface weather stations located in open, grassy fields for sites in North America (Lee et al. 2011) and subsequently extended for additional locations in eastern Asia and the tropical Americas (Zhang et al. 2014). In the tropics and subtropics (15° S – 20° N), the annual mean air temperature at the open sites is 0.67°C warmer than the forests; but in boreal latitudes (≥ 45° N), the open sites are 0.95°C cooler than forests. Weaker temperature change occurs between these regions. Latitude 35° N marks the approximate transition. South of this latitude, the warming is seen in an increase in daily maximum air temperature in all months of the year. The cooling at northern locations occurs from a decrease in the daily minimum temperature throughout the year. However, climate models simulate large-scale deforestation and resulting atmospheric changes whereas the measurements in forests and clearings represent local land-cover changes.
Biogeophysical Mechanisms and Ecohydrological Constraints. Our prevailing understanding of the climate effects of land-cover change is based on the low surface albedo of forests compared with grassland and cropland, and additionally that forests increase evapotranspiration relative to grassland and cropland. Deforestation increases albedo, but decreases evapotranspiration. The former process cools climate, while the latter process warms climate (Figures 28.2b and 28.19). Differences among vegetation in surface albedo are well-documented in observations, particularly the low albedo of forests in seasonally snow-covered regions (Figure 12.10, Table 26.3). Differences in evapotranspiration are evident in the tropics (Figure 28.11b, Table 28.10), but are less clear in mid-latitudes and are based mostly on a conceptualization of biogeophysical processes. The greater evapotranspiration of forests is expected because trees, with their vast system of foliage, branches, and trunks, increase interception and evaporation of precipitation; because their deep roots provide a large supply of water for transpiration; and because their tall canopy provides strong aerodynamic coupling with the atmosphere.
Water Budget and Watershed Hydrology Evidence. One line of evidence comes from water budget analyses. Paired watershed studies show that forest cover decreases annual runoff and increases annual evapotranspiration compared with forest removal (Bosch and Hewlett 1982; Zhang et al. 2001; Andréassian 2004; Brown et al. 2005; Farley et al. 2005), as shown in Figure 11.3 for the Hubbard Brook watershed. Such analyses do not measure evapotranspiration directly, but instead calculate it as the difference between annual precipitation and runoff:
· E = P - R
Syntheses of water budget analyses from various catchments worldwide similarly find that forests evaporate a greater proportion of annual precipitation (E / P) compared with grasslands (Zhang et al. 2001; Farley et al. 2005). This understanding may differ for crops. Water budget analyses across Sweden show no evidence that forests evaporate more water annually than agricultural land (van der Velde et al. 2013).
Conflicting Flux Tower Observations. Analyses of annual evapotranspiration from a variety of field measurements, models, and satellite estimates show that historical deforestation and other changes in land cover and land use have reduced global annual evapotranspiration, but they have conflicting outcomes of specific land-cover transitions (Sterling et al. 2013; Boisier et al. 2014). In the analysis of Sterling et al. (2013), non-irrigated cropland and pastureland reduce evapotranspiration compared with forests; croplands have lower evapotranspiration than grassland. Boisier et al. (2014) similarly found a robust, prominent decrease in growing season evapotranspiration where grasses replace forests, but an increase in summer evapotranspiration where crops replace grasses. The transition of forests to crops does not produce a consistent change in evapotranspiration, and what change there is is small compared with the forest-grass and grass-crop transitions.
Contrasting Ecohydrological Theories. Other evidence for the influence of land-cover change comes from eddy covariance flux tower measurements, but such studies reveal a conflicting story. Flux tower measurements show that pine and hardwood deciduous forests in North Carolina have greater annual and growing season evapotranspiration compared with an adjacent grassland (Stoy et al. 2006), and this is seen in a cooler surface temperature of the forests (Juang et al. 2007). Other analyses of flux tower data question the conventional understanding of high rates of evapotranspiration in forests. Measurements at forest, grassland, and cropland sites in Europe show that latent heat flux is larger at the non-forest sites than at the forests when soils are moist and that the forests have higher sensible heat flux (Teuling et al. 2010). The high sensible heat flux occurs because these forests have lower albedo and absorb more energy, have stronger stomatal control of transpiration, but are well-coupled aerodynamically with the atmosphere. With dry soils, however, latent heat flux declines sharply in short-rooted grassland and cropland and sensible heat flux increases, while the forests maintain their evapotranspiration. A global synthesis of flux tower measurements across forest, grassland, cropland, and other vegetation types shows that forests do not evaporate a larger fraction of annual precipitation (E / P) compared with grassland or cropland, and in fact broadleaf deciduous and needleleaf evergreen forests have a lower evaporative fraction than grasslands (Williams et al. 2012).
Photosynthetic Capacity and Bowen Ratio Dynamics. Agricultural crops have high rates of leaf photosynthesis (Table 16.1) and high values of the photosynthetic parameter Vc,max (Table 16.3) compared with trees. Theory suggests that these leaf-scale differences should manifest at the canopy scale. Some observations do indeed show that crops have a higher canopy conductance than forests or grasses (Table 17.2). Theory also suggests that the fraction of available energy consumed in evapotranspiration scales with the product of Vc,max times leaf area index (Baldocchi and Meyers 1998). The evaporative fraction during the growing season is generally low in forest compared with some crops and lower in dry conifer forest than in mesic broadleaf forest (Figure 17.10). Further analyses of summer (mid-June through late August) energy fluxes measured at temperate broadleaf deciduous forests, temperate and boreal needleleaf evergreen forests, and a cropland over multiple years show key differences among sites (Wilson et al. 2002). The deciduous forests and the cropland have a lower Bowen ratio (0.25–0.50) than the coniferous forests (generally 0.5–1.0), in part because their canopy conductance is higher.
Satellite Observations and Aerodynamic Roughness Effects. Satellite measurements of land surface temperature have been used to assess the consequences of land-cover change. Land surface temperature integrates changes in albedo, roughness, and evapotranspiration through the surface energy budget, as seen in Eq. (12.16). In the continental United States, forests have a cooler surface temperature than non-forest land, seen in the annual mean and in all seasons except winter (Wickham et al. 2012, 2013). Forests are on average 0.6°C cooler than cropland in the annual mean and 1.4°C cooler in summer (Wickham et al. 2012). This temperature difference occurs mainly in the daytime maximum; in summer, daily maximum temperature is 3.5°C cooler in forests than cropland. In winter, forests are warmer than cropland except in the southeastern region of the country (Wickham et al. 2014). In an analysis spanning North America, Zhao and Jackson (2014) also found that forests are cooler in warm seasons and warmer in cold seasons compared with adjacent grassland and cropland. The cooling occurs in daily maximum temperature, which is some 2–5°C cooler in forest compared with cropland, and a similar or larger daytime cooling occurs compared with grassland. Similar results are found in China, where the annual daytime temperature of forests is 1.1°C cooler than grassland or cropland, and seasonally up to 3°C cooler compared with croplands (Peng et al. 2014).
Sensible Heat Flux and Surface Roughness Mechanics. Conventional wisdom holds that the lower albedo of forests compared with cropland or grassland warms the surface while the higher evapotranspiration of forests cools the surface. However, changes in sensible heat flux with land-cover change may be a key driver of temperature change in temperate ecosystems and may outweigh changes in albedo. In an analysis of Eurasian and North American eddy covariance flux tower sites located in forest, grassland, and cropland, Luyssaert et al. (2014) found differences in surface temperature related to land cover, but such changes in temperature are not necessarily straightforward. Forests have the lowest annual albedo, croplands higher albedo, and grasslands highest albedo. When analyzed by land-cover transitions (e.g., forest to grassland), the change in annual mean albedo positively correlates with the change in annual mean surface temperature despite less available energy to heat the surface. Forests, grasslands, and croplands differ in surface roughness, and the amount of net radiation dissipated as sensible heat (H / Rn) increases with roughness length. At these sites, sensible heat flux is a key mechanism for surface cooling. In grasslands and croplands, the annual surface cooling from increased albedo is offset by less surface cooling from sensible heat flux because of lower roughness length.
Date added: 2026-09-24; views: 1;