
Impacts of Agricultural Land-Cover Conversion on North American Climate
Climatic Effects of Agricultural Land Conversion in North America. Large regions of forests in the eastern United States and grasslands in the Great Plains have been replaced with crops (Figure 23.10). Bonan (1997, 1999, 2001) and Oleson et al. (2004) performed a series of climate model simulations to study the effects of this change on the climate of the United States. In these simulations, conversion of forest to crop reduces surface roughness, decreases leaf area index (LAI), and increases stomatal conductance. Surface albedo increases in summer due to changes in leaf optical properties and in winter in snow-covered regions due to loss of trees that no longer mask the high albedo of snow. Croplands are also given loam soil texture to account for changes in soil hydraulic properties associated with agriculture.
Atmospheric and Land-Surface Modeling Insights. The simulations involved three different atmospheric models, two different land surface models, and various depictions of land-cover change. Despite these differences, all simulations indicate agriculture has cooled climate, but the magnitude of the cooling depends on the particular land-cover dataset and model. The most prominent climate signal is during summer, when evapotranspiration increases, atmospheric humidity increases, and surface air temperature decreases by up to 1–2°C in the Midwest region of intensive cropland (Figure 28.13).
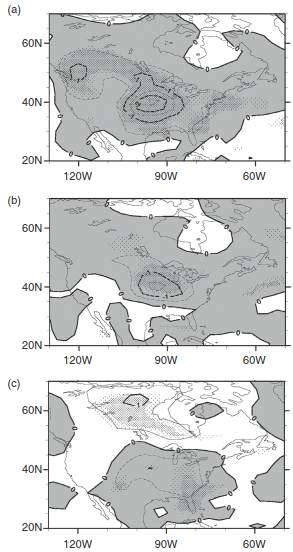
Fig. 28.13. Difference (present-day minus natural vegetation) in summer (June–August) surface air temperature. Shown are three different model simulations. All simulations used the Community Atmosphere Model (CAM2), but differed in land surface model and surface datasets. (a) National Center for Atmospheric Research land surface model (NCAR LSM) with biome datasets. (b) NCAR LSM with vegetation continuous fields datasets. (c) Community Land Model (CLM2) with vegetation continuous fields datasets. The contour interval in all Figures is 0.5°C. Shading indicates cooling. Light and dense stippling indicate regions where the difference is statistically significant. Adapted from Oleson et al. (2004).
Surface Energy Balance Mechanisms. The cooling largely arises from increased surface albedo that decreases net solar radiation at the surface. Net radiation decreases, which is balanced by lower sensible heat flux and higher latent heat flux. Feedback with the atmosphere is evident in increased cloudiness that reduces incoming solar radiation at the surface. The cooling is larger for daily maximum temperature than for daily minimum temperature so that diurnal temperature range decreases.
Model Variance and Comparative Studies. However, the magnitude of the cooling depends on the particular model. The smaller cooling of the CLM2 relative to the NCAR LSM (Figure 28.13b,c) relates to the formulation of transpiration and within-canopy turbulent transfer that make the CLM2 a warmer, drier model compared with the NCAR LSM. Other modeling studies also indicate summer cooling associated with land-cover change due to changes in surface albedo and moisture balance (Diffenbaugh 2009).
Regional Land-Use Historical Dynamics. Other studies find results differ depending on the type of land-cover change and that conversion of forest to cropland may have warmed climate. Baidya Roy et al. (2003) simulated July climate for the United States using land cover for 1700, 1910, and 1990. The model shows a warming of 0.3–0.6°C in the east where crops replaced forests between 1700 and 1910. Between 1910 and 1990, farm abandonment and reforestation in the east decreased temperatures. In contrast, agricultural expansion in the Midwest and Plains states has decreased temperature by 1°C or more.
Biophysical Factors of Biophysical Conversions. In this model, crops and grasses have similar albedo and roughness length, and the cooling where crops replace grasses is largely a result of increased evapotranspiration. Warming where crops replace forests is a balance of increased cropland albedo, reduced cropland roughness length, and deep tree roots, which sustain evapotranspiration compared with shorter-rooted crops.
Reforestation Impacts on Regional Climate. Differences among models are highlighted by several studies of reforestation and afforestation in southeastern United States. Much of this region is presently cropland or pastureland. Some modeling studies find that planting trees on this land cools summer temperature because of increased evapotranspiration (Jackson et al. 2005; Chen et al. 2012; Murphy et al. 2012). In contrast, another study reported that reforestation of croplands increases temperature throughout the year, with summertime warming up to 0.5°C in some locations (Trail et al. 2013). In this latter simulation, cropland has a higher stomatal conductance compared with forests, and high evaporative cooling from croplands has a large impact on the regional climate. A higher stomatal conductance for forests leads to cooling with reforestation.
Crop Phenology and Seasonal Variations. The type of crop represented in the model is important. The studies of Bonan (1997, 1999, 2001) and Oleson et al. (2004) represented crops with a summergreen phenology typical of corn or soybean in the United States. Corn is typically sown during April and May while soybeans are sown in May and June. These crops reach silking (corn) and flowering (soybean) stages in July, mature in August, and are harvested in September and October.
Phenological Variations in Winter Wheat. In contrast, other studies have represented crops by winter wheat. Winter wheat is planted in autumn. Seeds germinate prior to the onset of winter, whereupon plants become dormant until spring. Plants grow and mature throughout spring, with harvest typically in June or early July. This phenology, in which soils are not vegetated during much of summer, decreases latent heat flux, increases sensible heat flux, and warms surface air temperature upon conversion of forest to crop (Xue et al. 1996; Lamptey et al. 2005a,b). Accurate simulation of the seasonal cycle of crop growth, from planting to maturation to harvest, influences large-scale climate in midwestern United States, and the specific planting date can impact precipitation (Levis et al. 2012).
Seasonal Canopy Cover Effects. These changes occur because of differences in the seasonal cycle of leaf area and the length of time the surface is covered by growing vegetation (Twine et al. 2004; Sacks and Kucharik 2011; Levis et al. 2012). For example, Figure 28.14 compares the conversion of deciduous forest and grassland to winter wheat, spring wheat, and summer crops (corn, soybean).
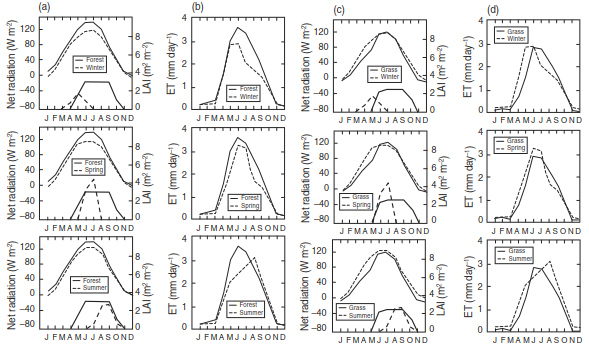
Fig. 28.14. Monthly net radiation, leaf area index (LAI), and evapotranspiration (ET) with land-cover change in the Mississippi River basin. (a) Net radiation for deciduous forest converted to winter wheat (top), spring wheat (middle), and summer crops (bottom). The thick lines overlain with net radiation show leaf area index. (b) As in (a), but for evapotranspiration. (c) Net radiation for grassland converted to winter wheat (top), spring wheat (middle), and summer crops (bottom). The thick lines overlain with net radiation show leaf area index. (d) As in (c), but for evapotranspiration. Model simulations are for a single grid cell in western Wisconsin forced with observed meteorology. Data from Twine et al. (2004).
Forest and Grassland Conversion Flux Dynamics. Net radiation decreases where forest is converted to crop. The winter decrease is due to the higher albedo of snow-covered ground. The summer decrease is due to changes in leaf optical properties and leaf area index that increase surface albedo. Monthly evapotranspiration is generally less than or equal to forest evapotranspiration, with a distinct seasonal pattern related to crop phenology. Winter wheat attains peak evapotranspiration rates in May–June when leaf area is highest and declines thereafter. Spring wheat evapotranspiration peaks in June–July with crop maturation, and summer crop evapotranspiration peaks in August. Sensible heat flux is generally less than forest during the crop growing season and greater than forest when crop fields are bare. Annual crop evapotranspiration is less than forest and has a distinct relation to phenology, which determines the duration of the evaporative season. The decrease in annual evapotranspiration is less for summer crops (15%) and greatest for winter wheat (23%).
Opposite Effects of Grassland Conversion. Conversion of grassland to crop has the opposite effects (Figure 28.14c,d). Net radiation is generally greater than or equal to grassland. The greatest increase is in spring, when crop albedo is less than that of dormant grass. This difference decreases during the growing season. Crop sensible heat flux is lower than grassland during the crop growing season, but is greater in spring and autumn when crop fields are bare and evapotranspiration is low. Annual evapotranspiration is greater for crops than grassland (winter wheat, 7%; summer crops, 17%).
Microclimatic Impacts of Winter Wheat Harvesting. Observations and models indicate harvesting of winter wheat warms the surface. In Oklahoma, a large belt of winter wheat 100–150 km wide extends across the state from Texas north to Kansas. In this region, wheat typically resumes growth in early March and becomes senescent by early May with harvest during late May and early June (Figure 28.15). In contrast, adjacent vegetation is primarily summergreen grassland.
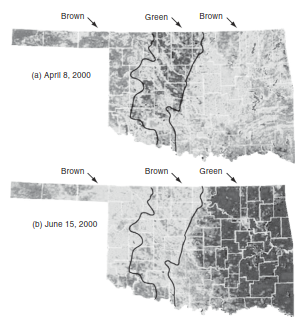
Fig. 28.15. Physiological state of vegetation in Oklahoma for the week ending on (a) April 8, 2000 and (b) June 15, 2000. A greenness index derived from the normalized difference vegetation index indicates growing vegetation. The black lines denote the winter wheat belt. The green wheat is surrounded by dormant grassland on April 8, 2000, but has been harvested by June 15, 2000 while the eastern grassland has become green. Adapted from Haugland and Crawford (2005). See also McPherson et al. (2004).
Boundary Layer Dynamics in the Wheat Belt. While wheat is actively growing in early spring, observations show that daily maximum air temperatures are cooler than over adjacent dormant grassland (McPherson et al. 2004). This cool anomaly disappears during May as grasses grow. Once the wheat is harvested, temperatures are warmer across the wheat belt in June–August compared with grassland. The atmosphere is also moister as a result of evapotranspiration from the growing wheat, most noticeably when soil water is abundant (Haugland and Crawford 2005). Model simulations show increased latent heat flux and decreased sensible heat flux of actively growing winter wheat compared with dormant grassland, which leads to a moister, shallower atmospheric boundary layer (McPherson and Stensrud 2005).
Land-Use Transition in the Canadian Prairies. The Canadian Prairies have undergone a significant change in agriculture over the past 30 years. More than five million hectares (ha) of land (1 ha = 10,000 m²) have been converted from summer fallow (in which the land was left bare for one year) to annual cropping. The land-use changes were largest in Saskatchewan, where 15–20 percent of the land area was converted from summer fallow to annual cropping. This change in land use has altered the summer climate, with increased evapotranspiration, decreased daily maximum temperature and diurnal temperature range, decreased incoming solar radiation, and increased precipitation (Gameda et al. 2007; Betts et al. 2013).
Quantitative Summary of Prairie Climate Shift. Table 28.12 summarizes changes between the years 1953–1991 and 1991–2011. During the growing season from May 20 to August 27, relative humidity increased by 7 percent. During the first two months of the growing season (May 20 to July 18) daily maximum temperature and the diurnal range of temperature decreased by 1.2°C and 0.6°C, respectively, cloud cover increased by about 4 percent, reducing surface net radiation by 6 W m⁻², and precipitation increased.
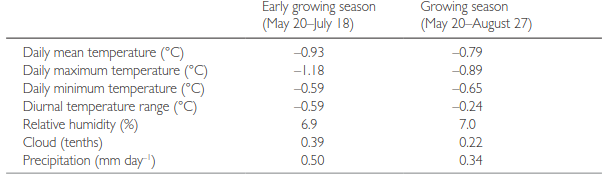
Fig. 28.12. Climatic parameter shifts resulting from summer fallow elimination in the Canadian Prairies and crop-forest-grassland conversions.
Date added: 2026-09-24; views: 1;