
Dynamics and Drivers of the Residual Terrestrial Carbon Sink
The Residual Terrestrial Land Sink. The residual land sink represents the net carbon accumulation by the terrestrial biosphere after comprehensively accounting for anthropogenic land-use emissions. Although the exact geographical distribution of this terrestrial carbon sink remains a subject of ongoing scientific investigation, consensus studies indicate a predominant presence within the boreal forests and temperate forests of the Northern Hemisphere (Gurney and Eckels 2011; Pan et al. 2011; Ciais et al. 2013). Alternative observational and modeling analyses highlight a potentially greater contribution from tropical forests (Stephens et al. 2007; Schimel et al. 2015). Continuous empirical monitoring confirms a significant carbon uptake in mature Amazonian and African tropical forests (Phillips et al. 1998, 2009; Lewis et al. 2009), though this sink capacity is heavily counterbalanced by global deforestation emissions, leaving tropical forest ecosystems near neutral with respect to net carbon flux.
Forest Carbon Budget Analysis. A foundational synthesis by Pan et al. (2011) utilized extensive forest inventory data and longitudinal tracking of forest carbon stocks to quantify global terrestrial fluxes for the period 1990–2007 (as detailed in Table 29.2). Their calculations established a total annual global forest carbon sink of 1.2 Pg C yr⁻¹ within boreal forests (0.5 ± 0.1 Pg C yr⁻¹) and temperate forests (0.7 ± 0.1 Pg C yr⁻¹). In parallel, undisturbed intact tropical forests sequestered an estimated 1.2 ± 0.4 Pg C yr⁻¹, which was nearly offset by anthropogenic land-use change releases amounting to 1.3 ± 0.7 Pg C yr⁻¹.
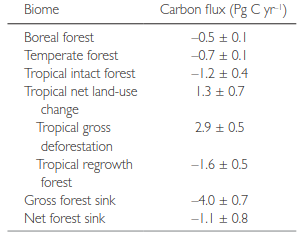
Table 29.2 Global forest carbon budget for 1990–2007. Note: Positive values denote sources. Negative values denote sinks. Boreal and temperate forests are the net flux, including land-use change and disturbance. Tropical forest fluxes are estimated separately for intact forests (unaffected by human activities) and regrowth forests (recovering from past deforestation and logging). Tropical gross deforestation is the total emission; net land-use change is the balance between gross deforestation emission and regrowth uptake. Source: From Pan et al. (2011).
Global Forest Flux Components. Net tropical land-use emissions were comprised of gross deforestation sources generating 2.9 ± 0.5 Pg C yr⁻¹ alongside forest regrowth sinks capturing 1.6 ± 0.5 Pg C yr⁻¹ following ecological disturbance. On a global level, boreal, temperate, and tropical forests collectively operated as a gross forest sink storing 4.0 ± 0.7 Pg C yr⁻¹ during this period, yielding a net forest sink of 1.1 ± 0.8 Pg C yr⁻¹. Because tropical ecosystems maintained a near-neutral net status, global net carbon accumulation was concentrated overwhelmingly within temperate and boreal biomes.
Drivers of Enhanced Biospheric Carbon Storage. Several primary biophysical processes explain this sustained increase in terrestrial carbon storage. These mechanisms include enhanced plant growth driven by CO₂ fertilization, altered climate effects on ecosystem respiration and gross primary production, and widespread nitrogen deposition stemming from industrial pollution and agricultural activities.
Mechanisms of Carbon Dioxide Fertilization. Global terrestrial biosphere models integrated with rising atmospheric CO₂ concentrations demonstrate elevated net primary production (NPP) and carbon storage via the CO₂ fertilization mechanism (Cramer et al. 2001; Sitch et al. 2008; Piao et al. 2013). Model comparison protocols across ten global frameworks (Piao et al. 2013) revealed that elevated atmospheric CO₂ increased mean NPP by 0.16% per ppm over the past three decades, aligning closely with observational data from Free-Air CO₂ Enrichment (FACE) experiments (0.13% ppm⁻¹). However, uncertainties remain regarding whether experimental FACE plots reflect mature, natural biomes, as well as the capacity of biosphere models to fully replicate ecosystem responses observed during long-term field studies (Zaehle et al. 2014).
Nutrient Constraints and Carbon Allocation. A key factor limiting the CO₂ fertilization response is nitrogen availability. Empirical studies show that nitrogen limitation can constrain productivity gains from CO₂ enrichment. Biosphere models featuring coupled carbon-nitrogen biogeochemistry project a smaller contribution from CO₂ fertilization to the terrestrial carbon sink than carbon-only models (Thornton et al. 2007, 2009; Jain et al. 2009; Bonan and Levis 2010; Zaehle et al. 2010b; Zhang et al. 2011; Gerber et al. 2013; Zaehle 2013). Furthermore, overall long-term sequestration depends on tissue allocation: allocating fixed carbon to woody biomass promotes long-term storage, whereas allocation to rapidly turnover tissues provides limited long-term soil carbon storage.
Observational Methods and Water-Use Efficiency. Detecting field-level productivity gains directly attributed to rising CO₂ is challenging due to confounding variables like temperature, precipitation, and stand dynamics. Nonetheless, increased water-use efficiency (WUE) remains a documented response. Measurements from eddy covariance flux towers in Northern Hemisphere forests (Keenan et al. 2013) and isotopic analyses in tropical trees (van der Sleen et al. 2015) indicate increases in WUE over recent decades, potentially contributing to vegetation greening in arid environments (Donohue et al. 2013).
Impacts of Climate Change on Terrestrial Fluxes. Secular climatic changes exert complex controls on the global carbon cycle. Satellite measurements of the normalized difference vegetation index (NDVI) indicate a longer growing season length (by approximately 1–2 weeks) and enhanced summer greenness across northern high latitudes since the late 20th century (Myneni et al. 1997; Slayback et al. 2003; Barichivich et al. 2013). Phenological field monitoring confirms earlier spring leaf emergence and delayed autumn senescence (Menzel et al. 2006; Schwartz et al. 2006; Jeong et al. 2011; Wolkovich et al. 2012).
Climate Constraints and Ecosystem Productivity. Long-term observations show that climate warming has enhanced net primary production where water availability is non-limiting (Boisvenue and Running 2006). Satellite records indicate that reduced climatic constraints promoted productivity during the 1980s and 1990s (Nemani et al. 2003). However, subsequent regional droughts offset these gains during the early 2000s (Zhao and Running 2010).
Disturbances and Atmospheric Interactions. Warmer conditions increase productivity but also accelerate soil carbon loss via decomposition and respiration. Extreme climate events—such as the 2003 European heatwave (Ciais et al. 2005) and the 2005/2010 Amazonian droughts (Phillips et al. 2009; Lewis et al. 2011)—cause tree mortality and carbon losses. Other major carbon disturbances include windthrows from severe storms (e.g., Hurricane Katrina; Negrón-Juárez et al. 2010), insect outbreaks like the mountain pine beetle (Kurz et al. 2008a), and altered wildfire regimes. Additionally, elevated atmospheric pollutants such as tropospheric ozone ($O_3$) induce stomatal closure, reducing photosynthesis and acting as a positive radiative forcing by suppressing land carbon storage (Wittig et al. 2007, 2009; Ainsworth et al. 2012).
Atmospheric Nitrogen Deposition and Forest Dynamics. Industrial, mobile, and agricultural activities release reactive nitrogen ($NO_x + NH_3$), which is deposited onto land ecosystems through wet deposition and dry deposition. Global anthropogenic land deposition is estimated at ~63 Tg N yr⁻¹ (Lamarque et al. 2010, 2011, 2013; Ciais et al. 2013). Deposition rates exceed 1 g N m⁻² yr⁻¹ in eastern North America and reach up to 5 g N m⁻² yr⁻¹ in parts of Europe.
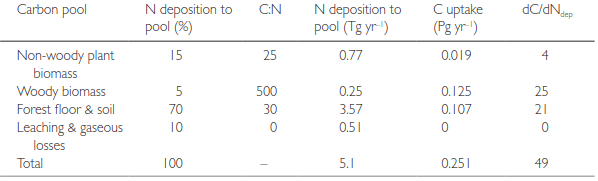
Table 29.3 Contribution of nitrogen deposition to carbon storage in forest ecosystems. Source: From Nadelhoffer et al. (1999).
Biogeochemical Stoichiometry and Carbon Partitioning. Carbon gains from nitrogen enrichment depend on ecosystem stoichiometry (C:N ratios) and uptake efficiency. As demonstrated in Table 29.3, woody biomass possesses a high C:N ratio (~500), enabling significant carbon storage per unit of nitrogen. In contrast, soil organic matter maintains a lower C:N ratio (10–30), yielding lower sequestration per unit of nitrogen. Consequently, while soils receive the majority of deposited nitrogen (~70%), woody biomass accounts for the majority of long-term carbon accumulation due to its higher C:N ratio.
Ecosystem Modeling and Attribution Analyses. Ecosystem model simulations evaluate the relative contributions of individual environmental factors to historical carbon sink trends.
Fig. 29.9 illustrates model simulations for forests in the northeastern United States using the PnET-CN framework (Ollinger et al. 2002).
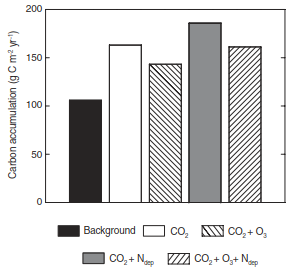
Fig. 29.9. Net carbon accumulation for the year 2000 simulated with the PnET-CN ecosystem model for forests in Northeast United States with CO₂, tropospheric ozone (O₃), and nitrogen deposition (N_dep) forcings. Adapted from Ollinger et al. (2002).
Model Attribution of Environmental Drivers. Model simulations show that historical land use and elevated atmospheric CO₂ increase carbon storage, whereas tropospheric ozone suppresses productivity. Combine simulation experiments indicate that interactive factors—such as nitrogen deposition and CO₂ fertilization—jointly drive the observed magnitude of the residual terrestrial sink.
Global simulations using the ORCHIDEE model (Piao et al. 2009) quantify trends in net primary production from 1980 to 2002, as shown in Fig. 29.10.
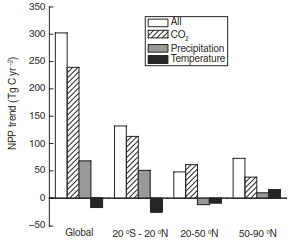
Fig. 29.10. Global and regional trends of annual net primary production (NPP) for 1980 to 2002 from ORCHIDEE simulations with all forcings and individually with only CO₂, precipitation, and temperature change. Adapted from Piao et al. (2009).
Regional Trends in Net Primary Production. ORCHIDEE model outputs demonstrate an overall global NPP increase of ~0.4% yr⁻¹ (~300 Tg C yr⁻¹) between 1980 and 2002, driven primarily by CO₂ fertilization[cite: 8]. In tropical regions (20°S–20°N), CO₂ fertilization was the primary driver of productivity trends, partially offset by temperature and precipitation variability[cite: 8]. In high-latitude boreal zones (50–90°N), climate warming further enhanced the CO₂ fertilization response.
To evaluate the influence of nutrient dynamics, the O-CN terrestrial biosphere model compared carbon-only (O-C) and carbon-nitrogen (O-CN) configurations (Zaehle et al. 2010b), as shown in Fig. 29.11.
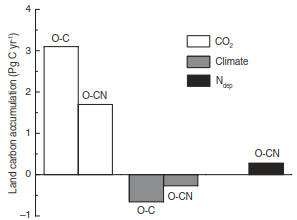
Fig. 29.11. Individual contribution of CO₂, climate change, and nitrogen deposition (N_dep) on net land carbon uptake in the 1990s simulated by the O-CN terrestrial biosphere model. Simulations are for carbon-only (O-C) and carbon-nitrogen (O-CN) implementations of the model. Adapted from Zaehle et al. (2010b).
Impact of Carbon-Nitrogen Coupling. The O-CN model comparative simulations demonstrate that incorporating nitrogen cycle dynamics reduces the estimated magnitude of the CO₂ fertilization response relative to carbon-only models[cite: 9]. Simultaneously, coupled nitrogen dynamics reduce projected climate-driven carbon losses due to enhanced nitrogen mineralization in warmer soils, highlighting the key role of nutrient interactions in global carbon cycle models.
Date added: 2026-09-24; views: 1;