
Ecological Niche Dynamics, Species Interactions, and Vegetation Patterns
Understanding the spatial arrangement of individual plants within populations and across multi-species communities requires analyzing the ecological niche. A niche represents the environmental components—both abiotic and biotic—to which a species is evolutionary adapted. Evolutionary pressures drive niche differentiation, leading species to develop distinct preferences for resources and unique functional roles within communities.
Rather than forming discrete, rigidly bounded natural associations, most plant communities intergrade continuously along environmental gradients. Species respond individualistically according to their specific physiological tolerances, life history patterns, competitive interactions, and local disturbance regimes.
Multidimensional Niche Spaces and Physiological Tolerances. Environmental conditions such as temperature, light, soil moisture, and nutrient availability vary continuously across landscapes. A species' biological performance—measured via growth, survival, or abundance—typically follows a bell-shaped response curve along a single environmental gradient, peaking at an optimal point and declining as conditions diverge.
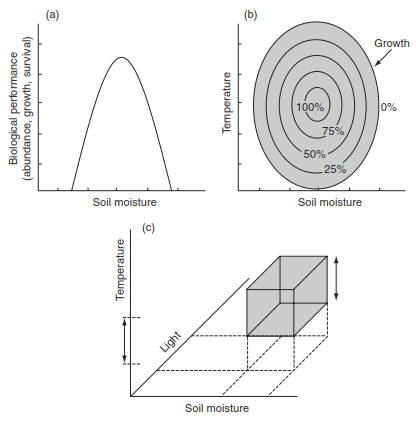
Fig. 19.1. Tolerance of a species in relation to environmental conditions. (a) Typical bell-shaped response to soil moisture. (b) Hypothetical response to soil moisture and temperature showing the range of conditions for which growth can occur and the decrease in growth away from this optimum. (c) Hypothetical range of conditions along three dimensions (soil moisture, temperature, light) over which growth is possible.
When mapped across multiple parameters, environmental tolerance forms a multidimensional niche volume:
· Two Dimensions: The intersection of soil moisture and temperature tolerances defines a two-dimensional zone of survival and growth.
· Three Dimensions: Adding light availability yields a 3D environmental cube bounded by upper and lower survival limits.
· Pollen Abundance Patterns: Empirical evidence from North American tree species illustrates distinct climatic optima (Webb et al., 1993):
o Quercus (Oak): Peak abundance occurs where annual precipitation reaches 1000 mm and July temperatures exceed 24 °C.
o Pinus (Northern Pine): Thrives in cooler, drier conditions (July temperature ~18 °C, annual precipitation < 750 mm).
o Picea (Spruce): Dominates cold, moist climates (July temperature ~12 °C, annual precipitation 750–1000 mm).
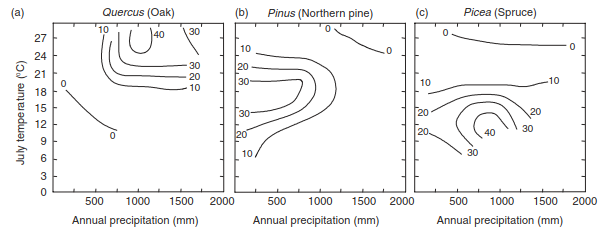
Fig. 19.2. Pollen abundance (%) in relation to July temperature and annual precipitation for (a) oak, (b) northern pine, and (c) spruce trees. Adapted from Webb et al. (1993).
Fundamental vs. Realized Niche and Microhabitat Variation. A species' fundamental niche encompasses the full spectrum of abiotic conditions under which it can survive and reproduce in isolation. However, in natural ecosystems, interspecific competition, functional roles, and resource partitioning constrain species to a smaller realized niche.
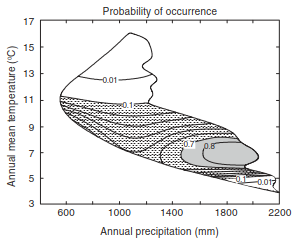
Fig. 19.3. Probability of occurrence of Eucalyptus pauciflora (snow gum) growing on granite rock in southeastern Australia in relation to annual mean temperature and annual precipitation. Adapted from Austin et al. (1990).
Field studies of Eucalyptus pauciflora (snow gum) on granite substrates in southeastern Australia (Austin et al., 1990) demonstrate how spatial distribution maps onto specific climatic limits:
· Optimal Climatic Zone: High occurrence probabilities center where annual precipitation exceeds 1400 mm and mean annual temperatures range between 6 °C and 8 °C.
· Marginal Tolerances: Probability of occurrence sharply declines in cooler regimes (< 5 °C) as well as warmer, drier conditions.
Functional Roles and Resource Partitioning. Functional roles involve how plants deploy traits to partition critical resources:
· Temporal Phenology: Deciduous understory plants often leaf out prior to overstory canopy closure, securing PAR (photosynthetically active radiation) early in spring.
· Root Stratification: Co-occurring species divide belowground space through contrasting shallow and deep root architectures (Grubb, 1977).
Physiological Tradeoffs and Competitive Displacement. Simulations of forest dynamics (Smith and Huston, 1989) highlight how physiological trade-offs determine vegetation patterns along resource gradients. A central trade-off exists between shade tolerance and drought tolerance.
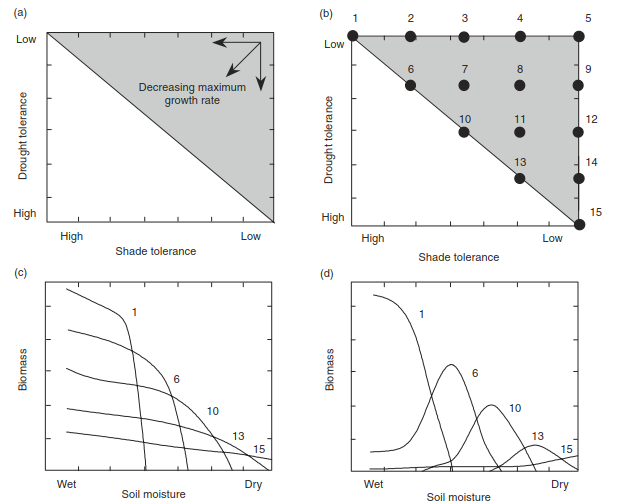
Fig. 19.4. Relationship between physiological tolerances and plant abundance along environmental gradients. Top: Possible plant strategies for light and water use represented as a continuum (a) and as 15 discrete plant functional types (b). The shaded triangle shows possible strategies based on tradeoff between light and water use. Bottom: Biomass of five plant functional types along a moisture gradient when grown in monocultures (c) and in mixed stands of all 15 plant types (d). Numbers denote plant functional types. Adapted from Smith and Huston (1989).
Key Insights from Monoculture vs. Mixed-Stand Dynamics:
1. Monoculture Performance: In the absence of competition, all species achieve maximum potential biomass on wet, resource-rich soils. Their range of survival along the gradient is dictated purely by individual drought tolerance levels.
2. Competitive Displacement in Mixed Stands: When grown together, superior competitors for light (shade-tolerant species) crowd out drought-tolerant species on wet soils.
3. Shift to Ecological Optimum: Competition forces stress-tolerant species toward drier soils—closer to their physiological stress limits than to their physiological optimum.
Invasive Species and Resource Alteration. Invasions by non-native species demonstrate how small differences in life history traits can disrupt native plant communities. In the semiarid Intermountain West of North America, the introduced winter annual cheatgrass (Bromus tectorum) has widely displaced the native perennial bluebunch wheatgrass (Agropyron spicatum) (Harris, 1967).
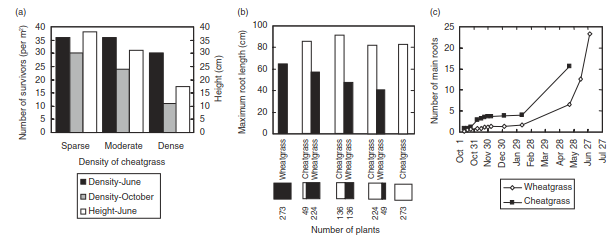
Fig. 19.5. Bluebunch wheatgrass (Agropyron spicatum) growth and survival in the presence of cheatgrass (Bromus tectorum). (a) Survival and height of wheatgrass under sparse, moderate, and dense amounts of cheatgrass. (b) Maximum root length of both grasses when grown in mixtures of 273 plants of varying amounts of wheatgrass and cheatgrass. (c) Temporal dynamics of root growth for wheatgrass and cheatgrass grown in isolation. Data from Harris (1967).
Mechanisms of Displacement:
- Phenological Advantage: Cheatgrass seeds germinate in autumn. Its roots continue growing through winter while wheatgrass root growth remains dormant.
- Soil Water Depletion: By spring, established cheatgrass roots reach deeper depths, exhausting soil moisture reserves before wheatgrass initiates active spring growth.
- Survival Impact: Over one growing season, wheatgrass seedling survival drops from 86% under sparse cheatgrass densities to 39% under dense cheatgrass cover, with mean wheatgrass height decreasing from 38 cm to 18 cm.
Ecosystem-Level Responses to Resource Shifts. Resource enrichment can alter competitive balances and transform ecosystem carbon storage dynamics (Tilman, 1987; Wedin and Tilman, 1996). In a 12-year nitrogen addition experiment conducted in Minnesota grasslands initially dominated by native C₄ species, chronic fertilization produced profound structural shifts.
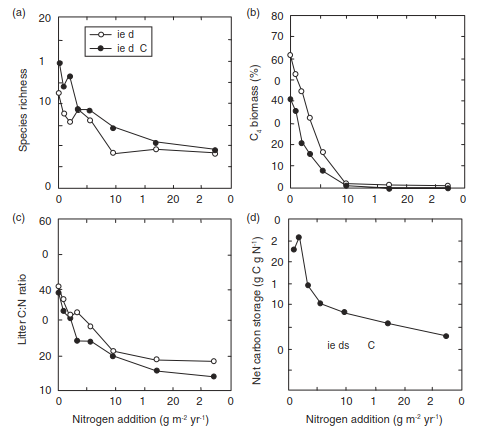
Fig. 19.6. Grassland response to 12 years of nitrogen addition. Data are mean values for several replicate plots in two old fields initially dominated by C₄ grasses. (a) Species richness (number of plants per 0.3 m²). (b) Biomass of C₄ plants as a percentage of total aboveground biomass. (c) C:N ratio of litter. (d) Net carbon storage per unit added nitrogen. Adapted from Wedin and Tilman (1996).
Consequences of Long-Term Nitrogen Addition:
- Loss of Biodiversity: Species richness declined by over 50% in high-nitrogen treatment plots.
- Functional Shift: The plant community shifted from stress-tolerant native C₄ grasses toward high-responding C₃ species.
- Reduced Carbon Sequestration: Despite higher net primary productivity, total ecosystem carbon storage decreased. C₃ plant tissue possesses a lower C:N ratio, causing litter to decompose faster and reducing long-term organic carbon accumulation in the soil.
Date added: 2026-09-24; views: 2;