
Carbon Dynamics and Biogeochemical Pools in Forest Ecosystems
The emphasis in ecosystem studies on the standing stock and cycling of materials provides a powerful conceptual framework to compare diverse biomes—such as deserts, grasslands, and tropical or boreal forests—in terms of common biological processes, flux rates, and environmental controls. Carbon serves as the primary currency for these interactions, moving continuously between living tissues, detritus, soil organic matter, and the atmosphere.
Conceptual Architecture of Terrestrial Carbon Pools. Understanding how carbon moves through terrestrial ecosystems requires conceptualizing the land surface as a network of interconnected pools with distinct turnover times and transfer efficiencies. A generalized representation partitions a terrestrial ecosystem into nine primary carbon pools:
1. Plant Carbon Pools (x₁ to x₃): Carbon fixed during gross primary production (GPP) is allocated to leaf (x₁), root (x₂), and wood (x₃) pools.
2. Litter Pools (x₄ to x₆): Senescent plant tissues undergo turnover, entering metabolic litter (x₄), structural litter (x₅), or coarse woody debris (CWD, x₆) pools.
3. Soil Organic Matter (SOM) Pools (x₇ to x₉): Microbial decomposition transfers litter carbon into active (x₇), slow (x₈), and passive (x₉) soil organic matter reservoirs.
Environmental conditions such as soil temperature and soil moisture, alongside chemical litter quality (e.g., lignin-to-nitrogen ratio), govern overall decay rates and determine how much carbon returns to the atmosphere through heterotrophic respiration (R_H) versus how much stabilizes within long-term soil organic carbon pools.
Dynamics of Generalized Terrestrial Carbon Storage. Carbon Pools and Transfer Parameters. The structural model tracks carbon stocks (x_i), mean turnover times (τ_i), transfer fractions (f_ij), and respiration fractions (r_ij) across plant, litter, and soil pools:
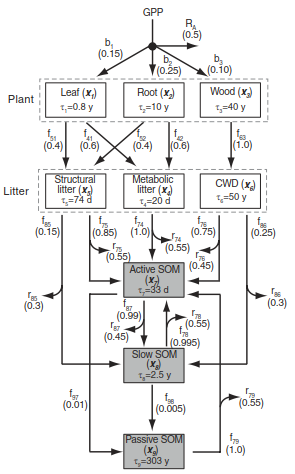
Fig. 20.2. Generalized representation of a terrestrial ecosystem as nine carbon pools and the carbon flows that connect these components. Plant carbon mass consists of leaf (x₁), root (x₂), and wood (x₃). Photosynthesis is allocated to plant material in proportion to b_i. Autotrophic respiration (R_A) is the remainder. Plant residue becomes metabolic litter (x₄), structural litter (x₅), or coarse woody debris (x₆). These pools decompose into active (x₇), slow (x₈), and passive (x₉) soil organic matter. The pools differ in turnover time (τ_i). Lines indicate carbon pathways, with f_ij the fraction of the total carbon loss represented by a pathway from pool j to pool i. Curved arrows denote heterotrophic respiration fluxes (R_H) for each pathway, with r_ij the respiration fraction. Shown are representative parameter values, with turnover time ranging from days (d) to years (y).
During plant uptake, gross primary production (GPP) is allocated to plant biomass pools based on partitioning coefficients (b₁ = 0.15 for leaves, b₂ = 0.25 for roots, b₃ = 0.10 for wood). Autotrophic respiration (R_A) accounts for the remaining fraction (0.5). Litter pathways partition foliage turnover into structural litter (f₅₁ = 0.4) and metabolic litter (f₄₁ = 0.6), root turnover into structural (f₅₂ = 0.4) and metabolic (f₄₂ = 0.6), and wood turnover entirely into CWD (f₆₃ = 1.0). Decomposition transfers carbon into active, slow, and passive SOM pools with specific heterotrophic respiration losses (r_ij) associated with each pathway.
Biome Carbon Accounting and Net Carbon Balance. At fundamental physical scales, the net accumulation or loss of carbon stored within a terrestrial ecosystem equals carbon uptake through photosynthesis minus carbon release through respiration. This basic mass balance is defined as net ecosystem production (NEP):
NEP = GPP − R_E = (GPP − R_A) − R_H = NPP − R_H
Here, a positive flux indicates net land uptake of carbon from the atmosphere. Autotrophic respiration (R_A) includes metabolic growth and maintenance costs in plant tissues, which typically consume approximately 50% of GPP across diverse grassland and forest biomes. The remaining carbon represents net primary production (NPP = GPP − R_A), which constructs new leaves, wood, and roots. Microbial decomposition of dead organic matter generates heterotrophic respiration (R_H), combining with R_A to form total ecosystem respiration (R_E = R_A + R_H). The land-atmosphere carbon balance is also expressed as net ecosystem exchange (NEE = R_E − GPP = −NEP), where positive values denote carbon sources to the atmosphere.
Non-respiratory disturbance processes—such as wildfires, timber harvesting, herbivory, lateral carbon leaching, and trace gas emissions (e.g., volatile organic compounds, CH₄, CO)—further extract carbon from the system. Incorporating these non-respiratory losses into long-term accounts yields the net ecosystem carbon balance (NECB), which generalizes to net biome production (NBP) when aggregated across large spatial regions.
Carbon Dynamics in Forest Ecosystems. Empirical Carbon Budgets Across Forest Biomes. Continental-scale evaluations highlight significant variations in carbon fluxes across forest biomes:
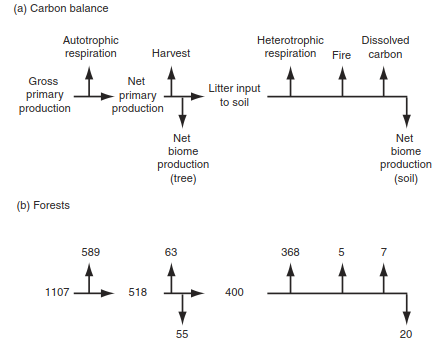
Fig. 20.3. Annual carbon balance of European forests. Fluxes are in g C m⁻² yr⁻¹ and include losses from harvest, fire, and dissolved organic and inorganic carbon. Data from Schulze et al. (2009, 2010).
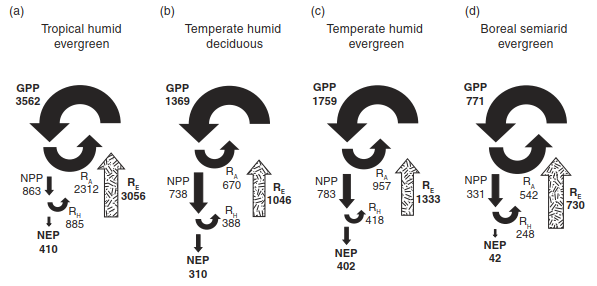
Fig. 20.4. Annual carbon fluxes (g C m⁻² yr⁻¹) for (a) tropical humid evergreen, (b) temperate humid deciduous, (c) temperate humid evergreen, and (d) boreal semiarid evergreen forests. These carbon fluxes do not balance. The size of the arrows is proportional to the fluxes within each forest. Data from Luyssaert et al. (2007).
Across European forests, less than 10% (75 g C m⁻² yr⁻¹) of annual GPP (1107 g C m⁻² yr⁻¹) accumulates locally due to respiratory and non-respiratory losses. Global synthesis data show that GPP ranges from >3500 g C m⁻² yr⁻¹ in tropical forests to 1400–1800 g C m⁻² yr⁻¹ in temperate systems and ~800 g C m⁻² yr⁻¹ in boreal systems. Autotrophic respiration consumes 49% to 70% of GPP, with the lowest proportional losses occurring in temperate zone climates. Global forest NEP ranges between 42 and 410 g C m⁻² yr⁻¹, representing 5–23% of total GPP.
Structural Carbon Allocation in Subarctic Boreal Forests. Structural Attributes and Biomass Pools. Comparative analysis of even-aged subarctic stands in Prince Albert National Park, Saskatchewan, Canada, demonstrates how species composition and environmental drainage shape ecosystem structure:
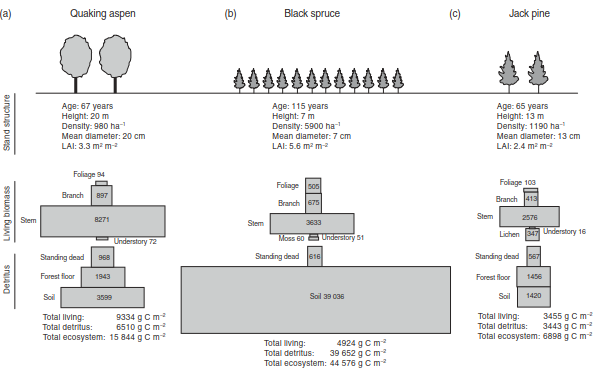
Fig. 20.5. Stand structure and carbon storage for quaking aspen, black spruce, and jack pine forests in central Saskatchewan. Living biomass is aboveground only. Standing dead, forest floor, and mineral soil carbon comprise total detrital carbon (decaying material). Boxes are proportional in size to carbon pools and have units of g C m⁻². Data from Gower et al. (1997).
Biogeochemical Mechanisms of Forest Carbon Storage. The physical structure and carbon partitioning of these boreal stands reflect underlying climate-soil-vegetation interactions:
- Quaking Aspen: Grows on moderately drained loam, producing large individual trees with high stem wood accumulation (8271 g C m⁻², comprising 88% of living aboveground carbon). Soil organic carbon accounts for 35% of total ecosystem carbon.
- Jack Pine: Occupies well-drained, coarse sandy soils with low water-holding capacity, exhibiting lower total biomass (3455 g C m⁻² living biomass) and an understory rich in reindeer lichen (347 g C m⁻²).
- Black Spruce: Thrives on cold, poorly drained mineral soils capped by a 20–30 cm peat layer. Despite lower tree heights (7 m) and individual wood biomass, black spruce stands achieve high tree densities (5900 ha⁻¹).
Due to anaerobic, waterlogged conditions that slow microbial decomposition, the black spruce ecosystem stores 44,576 g C m⁻² of total carbon—nearly 3 times that of the aspen forest and 6 times that of the jack pine forest. Soil organic carbon accounts for 88% of total ecosystem carbon in the black spruce forest. These figures demonstrate that long-term carbon storage in cold ecosystems is primarily controlled by belowground detrital accumulation rather than living plant biomass.
Date added: 2026-09-24; views: 1;