
Comparative Nutrient Dynamics: The Calcium and Nitrogen Cycles
Biogeochemical mechanisms vary depending on elemental phase properties. Elements without a prominent gaseous phase, such as calcium, rely heavily on organic cycling, bedrock weathering, and cation exchange capacity (CEC) within the soil solution.
Calcium Cycling Dynamics at Hubbard Brook. The calcium cycle observed in a 55-year-old northern hardwood forest at the Hubbard Brook Experimental Forest exemplifies non-gaseous nutrient dynamics (as shown in Fig. 20.11a).
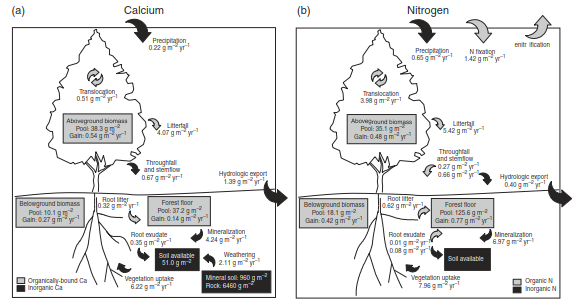
Fig. 20.11. Annual biogeochemical cycles for (a) calcium and (b) nitrogen in a 55-year-old northern hardwood forest ecosystem in the Hubbard Brook Experimental Forest. Boxes show major stores. Arrows show annual fluxes. Calcium data from Likens et al. (1977, p. 96). Nitrogen data from Bormann et al. (1977), Likens et al. (1977, p. 101), and Bormann and Likens (1979, p. 76). See Likens et al. (1998) for updated calcium pools and fluxes.
In this ecosystem, calcium pools are partitioned across several key reservoirs:
· Living plant biomass: 48.4 g m⁻²
· Decaying forest floor litter: 37.2 g m⁻²
· Available soil solution: 51.0 g m⁻²
· Mineral soil: 960 g m⁻²
· Underlying rock matrix: 6460 g m⁻²
The vast majority of ecosystem calcium is bound within the soil-rock complex, while living vegetation contains a relatively small fraction. The balance of annual calcium influxes and internal recycling determines soil solution availability:
· Precipitation imports: 0.22 g m⁻² yr⁻¹
· Throughfall and stemflow (leaching from leaves and bark): 0.67 g m⁻² yr⁻¹
· Root exudates: 0.35 g m⁻² yr⁻¹
· Litter mineralization: 4.24 g m⁻² yr⁻¹
· Mineral weathering: 2.11 g m⁻² yr⁻¹
Vegetation absorbs 6.22 g m⁻² yr⁻¹ of calcium during annual growth. Of this total uptake, only 0.81 g m⁻² yr⁻¹ (13%) accumulates as net structural biomass increase. Approximately 65% of uptake (407 g m⁻² yr⁻¹) returns to the forest floor via aboveground litterfall, while root mortality accounts for 0.32 g m⁻² yr⁻¹. Combined leaching losses via throughfall, stemflow, and root exudation equal 1.02 g m⁻² yr⁻¹. Hydrologic runoff exports approximately 18% (1.39 g m⁻² yr⁻¹) of available calcium out of the ecosystem.
The Complex Nitrogen Cycle and Chemical Pathways. The nitrogen cycle is fundamentally more complex because nitrogen exists in both gaseous and ionic states within terrestrial environments.
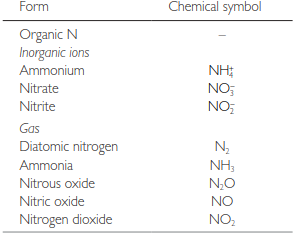
Table 20.2. Main forms of nitrogen in the environment
Unlike calcium, nitrogen is not a major component of primary or secondary rock minerals; weathering releases virtually no nitrogen into the soil. The primary long-term global reservoir of nitrogen is the atmosphere, whereas localized ecosystem reserves are held within plant biomass and soil organic matter (SOM).
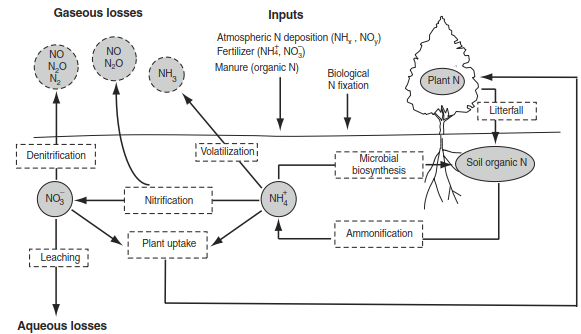
Fig. 20.12. The plant–soil nitrogen cycle. Circles indicate various pools (solid lines) or gaseous losses (dashed lines). Boxes denote processes. Also shown are natural inputs from biological nitrogen fixation and anthropogenic inputs from nitrogen deposition, fertilizer, and manure. Adapted from Bouwman et al. (2009).
The terrestrial nitrogen cycle consists of four primary biological and chemical transformations:
1. Biological nitrogen fixation: The reduction of atmospheric diatomic nitrogen (N₂) into bioavailable forms (NH₄⁺, NO₃⁻).
2. Mineralization (Ammonification): The breakdown of organic nitrogen compounds into inorganic ammonium (NH₄⁺) by decomposers.
3. Nitrification: The biological oxidation of ammonium (NH₄⁺) to nitrite (NO₂⁻) and subsequently to nitrate (NO₃⁻).
4. Denitrification: The enzymatic reduction of nitrate (NO₃⁻) to gaseous nitrous oxide (N₂O) and diatomic nitrogen (N₂), returning nitrogen to the atmosphere (as shown in Fig. 20.12).
Additional loss pathways include ammonia volatilization (the gas loss of NH₃ into the atmosphere) and nitrate leaching. Because soils exhibit a higher cation exchange capacity than anion exchange capacity, negatively charged nitrate ions (NO₃⁻) leach far more readily from the soil solution than positively charged ammonium cations (NH₄⁺).
Atmospheric Fixation and Global Nitrogen Fluxes. Although N₂ comprises 78% of Earth's atmosphere, it is chemically unreactive and unavailable to non-fixing plants. Specialized microbial species—often acting in symbiotic relationships with plant families like legumes (Fabaceae) or through free-living bacteria—perform biological nitrogen fixation.
Preindustrial terrestrial biological nitrogen fixation is estimated at 58 Tg N yr⁻¹ (Vitousek et al., 2013). Global biological fixation estimates reach approximately 195 Tg N yr⁻¹ (range: 100–290 Tg N yr⁻¹; Cleveland et al., 1999), with prominent activity in tropical ecosystems (Houlton et al., 2007). In global budgets, biological fixation contributes ~138 Tg N yr⁻¹, lightning strikes fix ~5 Tg N yr⁻¹, and anthropogenic fossil fuel combustion adds ~25 Tg N yr⁻¹ through atmospheric deposition (Galloway et al., 2004).
Nutrient Translocation and Comparative Ecosystem Dynamics. Plants meet a substantial portion of their annual growth requirement through internal nutrient conservation prior to leaf senescence, a mechanism termed translocation or retranslocation.
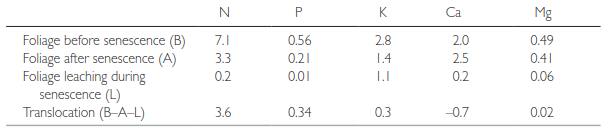
Table 20.3. Translocation of nutrients (g m⁻² yr⁻¹) in a 55-year-old northern hardwood forest in the Hubbard Brook Experimental Forest. Source: From Ryan and Bormann (1982).
As detailed in Table 20.3, trees reabsorb approximately 50% of leaf nitrogen and 60% of leaf phosphorus prior to abscission. Translocation supplies ~34% of total annual nitrogen uptake requirements and ~30% of phosphorus requirements during active growth phases. Calcium, being structurally immobile within plant tissue, shows negative translocation values (-0.7 g m⁻² yr⁻¹), reflecting continued accumulation or foliar leaching rather than resorption.
Hubbard Brook vs. Walker Branch Forest Dynamics. At Hubbard Brook, total nitrogen reserves in living vegetation equal 53.2 g m⁻², while the forest floor debris pool contains 125.6 g m⁻² (as shown in Fig. 20.11b). Atmospheric precipitation contributes 0.65 g m⁻² yr⁻¹ (as NO₃⁻ and NH₄⁺), and fixation supplies 1.42 g m⁻² yr⁻¹. Of the total 2.07 g m⁻² yr⁻¹ entering the ecosystem, 81% is retained internally; only 0.40 g m⁻² yr⁻¹ is lost to stream export, illustrating a tight biogeochemical cycle.
Comparative studies at the Walker Branch watershed (Oak Ridge, Tennessee; elevation 265–350 m) evaluated three distinct 70-year-old forest stands: Chestnut oak, Yellow poplar, and Oak-hickory (as shown in Fig. 20.13 and Fig. 20.14).
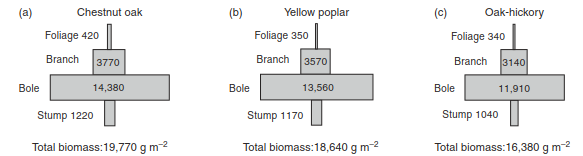
Fig. 20.13. Aboveground biomass in 70-year-old chestnut oak, yellow poplar, and oak-hickory forests in the Walker Branch watershed near Oak Ridge, Tennessee. Boxes are proportional in size to pools. Data from Edwards et al. (1989).
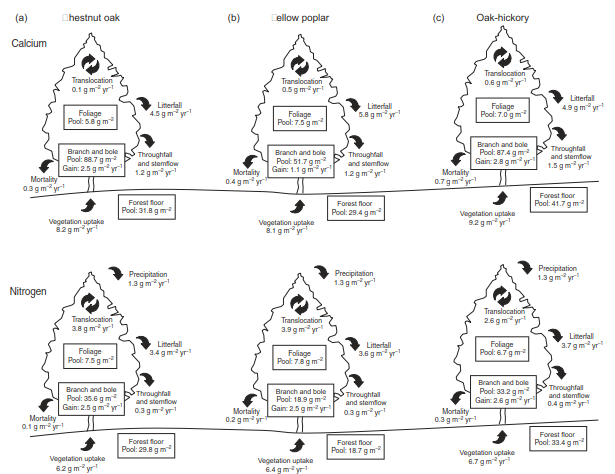
Fig. 20.14. Annual aboveground biogeochemical cycles for calcium (top) and nitrogen (bottom) in 70-year-old chestnut oak, yellow poplar, and oak-hickory forests in the Walker Branch watershed near Oak Ridge, Tennessee. Boxes show major stores. Arrows show annual fluxes. Data from Johnson and Henderson (1989).
Aboveground biomass totals across the three Walker Branch stands are:
· Chestnut oak: 19,770 g m⁻²
· Yellow poplar: 18,640 g m⁻²
· Oak-hickory: 16,380 g m⁻²
All three forest ecosystems display similar cycling pathways for calcium and nitrogen. Annual foliar nutrient requirements (Ca: 5.8–7.5 g m⁻² yr⁻¹; N: 6.7–7.8 g m⁻² yr⁻¹) significantly exceed woody growth requirements (Ca: 1.1–2.8 g m⁻² yr⁻¹; N: 2.5–2.6 g m⁻² yr⁻¹). Foliage accounts for roughly 75% of total annual nutrient demand. Translocation accounts for 28–38% of annual nitrogen requirements and 1–6% of calcium requirements at Walker Branch.
Organic Matter Turnover Rates. The turnover time of nutrients on the forest floor is calculated as total forest floor nutrient content divided by total annual inputs (litterfall + throughfall + stemflow).
The turnover times for calcium are substantially shorter at Walker Branch compared to Hubbard Brook:
· Hubbard Brook: 7.8 years
· Walker Branch (Chestnut oak): 5.6 years
· Walker Branch (Yellow poplar): 4.2 years
· Walker Branch (Oak-hickory): 6.5 years
For nitrogen, turnover times are:
· Hubbard Brook: 19.8 years
· Walker Branch (Chestnut oak): 8.1 years
· Walker Branch (Yellow poplar): 4.8 years
· Walker Branch (Oak-hickory): 8.1 years
The longer nitrogen turnover time at Hubbard Brook does not stem from lower litter input rates, but rather reflects the presence of a significantly larger accumulated organic nitrogen pool in its cold-temperate forest floor floor matrix.
Date added: 2026-09-24; views: 2;