
Carbon Fluxes and Nitrogen Dynamics in Terrestrial Ecosystems
Introduction to Ecosystem Carbon and Nutrient Dynamics. Understanding the mechanics of terrestrial carbon sequestration and nutrient cycling is fundamental to biosphere modeling and climate change mitigation. Eddy covariance flux measurements illustrate seasonal changes in ecosystem carbon fluxes with high temporal resolution. While field instrumentation can directly measure only net fluxes, mathematical modeling allows researchers to partition this net flux into two primary component fluxes: gross primary production (GPP) and ecosystem respiration (Rₑ) (Reichstein et al. 2005; Lasslop et al. 2010).
The balance between carbon uptake via photosynthesis and carbon release via autotrophic and heterotrophic respiration determines whether a terrestrial biome acts as a net carbon sink or source. Examining these dynamics across diverse global biomes reveals distinct seasonal profiles driven by microclimate, soil thermodynamics, and moisture availability.
Environmental Controls on Net Primary Production in Boreal Forests. In high-latitude subarctic ecosystems, soil thermal regimes and nitrogen availability serve as the primary limiting drivers of primary productivity. Experimental observations near Fairbanks, Alaska, demonstrate clear relationships between thermal sum, nutrient mineralization, organic layer thickness, and tree species productivity.
As soil thermal input increases—measured in soil degree-days above 0 °C accumulated at a 10 cm depth from May 20 to September 10—the accumulation of organic material on the forest floor decreases significantly. Conversely, tree growth rates show a strong positive correlation with soil thermal degree-days and annual nitrogen mineralization rates.
The data highlight key structural and functional differences across successional stages:
· Early-to-mid successional deciduous species (Quaking aspen, Balsam poplar, and Paper birch) exhibit high annual nitrogen requirements, high rates of nitrogen mineralization, thin forest floor accumulation, and superior aboveground biomass production.
· Late successional evergreen conifers (Black spruce and White spruce) operate on conservative nutrient cycles characterized by thick organic forest floor layers, low nitrogen mineralization, low nitrogen requirements, and reduced annual tree production.
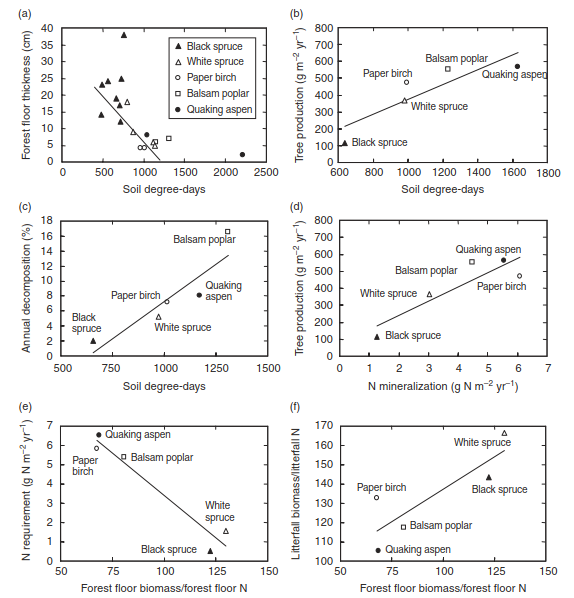
Fig. 20.19. Controls of net primary production and nutrient cycling in boreal forests near Fairbanks, Alaska. (a) Forest floor thickness in relation to soil degree-days above 0°C accumulated at a 10 cm depth from May 20 to September 10. (b) Annual aboveground tree production in relation to soil degree-days. (c) Annual forest floor decomposition in relation to soil degree-days. (d) Annual aboveground tree production in relation to annual nitrogen mineralization. (e) Annual nitrogen requirement in aboveground tree production in relation to the ratio of forest floor biomass to nitrogen. (f) Ratio of litterfall biomass to nitrogen in relation to forest floor biomass-to-nitrogen ratio. The data in panel (a) are from Viereck et al. (1983) for eight black spruce, four white spruce, two paper birch, two quaking aspen, and two balsam poplar stands. The data in panels (b)–(f) are averages for the five forest types (Van Cleve et al. 1983b; Fox and Van Cleve 1983). Van Cleve et al. (1983b) show data for individual stands. The overall patterns and conclusions are the same.
Cross-Biome Seasonal Carbon Flux Profiles. Global biomes exhibit contrasting regimes of gross primary production (GPP), ecosystem respiration (Rₑ), and net ecosystem exchange (NEE). Net carbon flux is quantified in terms of net ecosystem exchange, defined by the fundamental carbon balance equation:
NEE = -NEP = Rₑ - GPP
Negative values of NEE indicate net carbon sequestration by the ecosystem (a carbon sink), whereas positive values denote net carbon loss to the atmosphere (a carbon source).
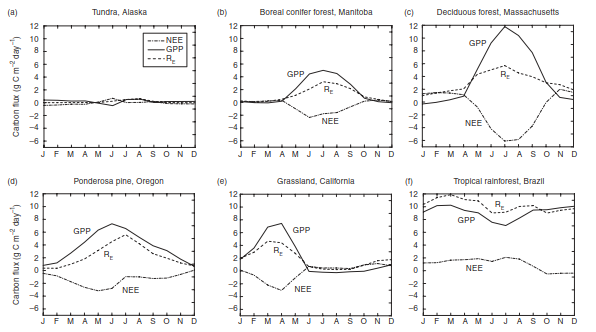
Fig. 20.20. Monthly carbon fluxes for (a) moist tundra, Alaska, (b) boreal conifer forest, Manitoba, (c) temperate deciduous forest, Massachusetts, (d) ponderosa pine, Oregon, (e) grassland, California, and (f) tropical rainforest, Brazil. Net carbon flux is given in terms of net ecosystem exchange (NEE = -NEP = Rₑ - GPP). See Figures 10.3 and 12.3 for monthly water and energy fluxes.
Biome-Specific Flux Patterns
- Tundra Ecosystems: Tundra biomes maintain minimal absolute carbon fluxes year-round due to extreme temperature limitations and short growing windows.
- Boreal and Temperate Deciduous Forests: Boreal conifer forests and temperate deciduous forests display pronounced annual cycles characterized by high rates of GPP during the summer growing season, yielding substantial seasonal net carbon uptake.
- Ponderosa Pine Forests: Intermediately regulated by temperature and seasonal water supply, showing steady springtime and early summer primary productivity.
- Grasslands: Mediterranean and temperate grasslands, such as those in California, experience an annual cycle strongly dictated by seasonal precipitation patterns, achieving maximum carbon assimilation during the wet winter and spring months.
- Tropical Rainforests: Equatorial rainforests exhibit large, continuous baseline rates of both GPP and Rₑ with minimal intra-annual variation relative to high-latitude biomes.
Long-Term Carbon Flux Dynamics: Harvard Forest Case Study. Long-term eddy covariance measurements conducted at the Harvard Forest in central Massachusetts from 1992 through 1999 provide vital insights into seasonal and interannual dynamics of net ecosystem production (NEP) (Goulden et al. 1996a,b).
The regional climate is classified as humid continental, characterized by warm-to-cool summers, cold winters, and substantial seasonal thermal amplitude. The dominant tree canopy at the study site—aged 50–70 years with canopy heights ranging from 20 to 24 m—consists of Red oak (Quercus rubra), Red maple (Acer rubrum), and scattered stands of Eastern white pine (Pinus strobus), Red pine (Pinus resinosa), and Eastern hemlock (Tsuga canadensis).
Seasonal and Interannual Sequestration Rates. Carbon uptake in the Harvard Forest varied sharply by season:
· Growing Season: Active carbon uptake occurred during spring, summer, and autumn, with typical daily net gains between 3 and 6 g C m⁻² day⁻¹. Peak daily GPP reached values exceeding 10 g C m⁻² day⁻¹.
· Dormant Season: Respiration dominated during cold dormant periods, resulting in consistent daily net losses of 1 to 2 g C m⁻² day⁻¹. Winter Rₑ averaged approximately 1 g C m⁻² day⁻¹, whereas summer Rₑ exceeded 5 g C m⁻² day⁻¹ due to elevated plant metabolism and microbial activity.
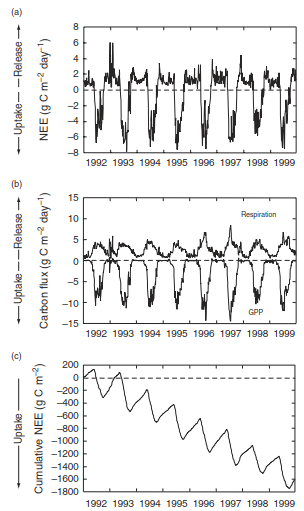
Fig. 20.21. Daily eddy covariance carbon fluxes for Harvard Forest, Massachusetts, 1992–1999 (a) Daily net ecosystem exchange. (b) Daily gross primary production and ecosystem respiration. (c) Cumulative net carbon flux. Negative values indicate carbon uptake. Positive values show carbon loss. Data from Goulden et al. (1996a,b). See also Figure 20.20c for monthly fluxes.
Between 1992 and 2004, annual net carbon assimilation at Harvard Forest ranged between 100 and 470 g C m⁻² yr⁻¹. Over the primary 1992–1999 monitoring period, net annual carbon sequestration increased at a rate of 15 g C m⁻² yr⁻¹ per year.
Because annual NEP represents a small net difference between two large gross terms (GPP and Rₑ), small anomalies in environmental conditions significantly shifted the net carbon sink capacity:
1. Canopy Phenology: Minor variations in spring leaf emergence or autumn senescence timing (6–10 days) caused broad shifts in total annual GPP (up to 50 g C m⁻²).
2. Cloud Cover: Extended summer cloudiness (e.g., July 1992, August 1992, August 1994) suppressed photosynthetically active radiation, reducing seasonal GPP by approximately 40 g C m⁻².
3. Snow Insulation: Deep winter snowpacks insulated underlying soils, maintaining elevated dormant-season soil temperatures and driving abnormally high winter Rₑ losses.
4. Summer Drought: Mid-summer moisture deficits simultaneously constrained primary production and elevated respiratory stress.
Subarctic Boreal Carbon Balance and Stable Isotope Dynamics. Subarctic Boreal Spruce Carbon Exchange. Parallel long-term eddy covariance research conducted in a subarctic boreal black spruce forest in central Manitoba (Goulden et al. 1997, 1998) highlights distinct carbon flux limits. The regional landscape features two primary micro-topographical zones:
· Upland Zones: Dense stands of 120-year-old Black spruce (~10 m tall) over a Feathermoss ground layer.
· Lowland Zones: Sparse Black spruce (1–6 m tall) growing over a Sphagnum moss layer.
During the short growing season, daily GPP ranged from 5 to 8 g C m⁻² day⁻¹, while daily Rₑ ranged from 5 to 10 g C m⁻² day⁻¹. On an annual basis, total carbon fixed via GPP (600–800 g C m⁻² yr⁻¹) was almost entirely counterbalanced by total respiratory loss (Rₑ), leaving only a slight net residual carbon sink.
Stable Carbon Isotopes in the Terrestrial Carbon Cycle. Analogous to the hydrologic cycle, the metabolic turnover of terrestrial ecosystems leaves a distinct tracer signature in atmospheric stable carbon isotopes (¹³C/¹²C).
Atmospheric carbon dioxide exhibits a δ¹³C signature of approximately -8‰. This isotopic ratio fluctuates seasonally in response to global photosynthetic fixed uptake and respiratory release. Furthermore, atmospheric δ¹³C is systematically declining over time (becoming depleted in ¹³C) due to anthropogenic fossil fuel combustion and deforestation.
Plants utilizing the C₃ photosynthetic pathway preferentially discriminate against the heavier ¹³C isotope during enzymatic carboxylation by RuBisCO, yielding a tissue δ¹³C range between -22‰ and -34‰. Consequently, the δ¹³C of respired ecosystem CO₂ directly reflects the isotopic composition of synthesized plant tissue, ranging between -24‰ and -30‰ in C₃-dominated biomes (Pataki et al. 2003; Bowling et al. 2008). Tracking these isotopic shift ratios provides essential constraints for partitioning regional-to-global carbon fluxes between marine and terrestrial sinks.
Date added: 2026-09-24; views: 1;