
Mechanisms of Terrestrial Decomposition and Mineralization
Introduction to Ecosystem Nutrient Cycling. In terrestrial ecosystems, the recycling of nutrients is fundamental to sustaining primary productivity. In addition to nutrients released through the chemical weathering of rocks, vital elements are bound within organic structures including leaves, branches, stems, roots, and other plant residue. Over time, this plant litter falls to the ground, where microbes and other soil microorganisms consume the organic substrate. These decomposers derive metabolic energy from carbon while breaking residues into progressively smaller fragments.
This process of biological and physical breakdown is termed decomposition. As plant detritus undergoes extensive degradation until it is no longer visually or structurally recognizable, it transforms into soil organic matter or humus. Heterotrophic respiration by soil microbes during decomposition converts organic carbon into carbon dioxide (CO₂), returning approximately ~50–60 Pg C yr⁻¹ back to the atmosphere. Concurrently, nutrients bound within organic molecules are transformed into bioavailable inorganic forms accessible to plants, a process designated as mineralization.
Mathematical Modeling of Litter Decay Dynamics. The rate of organic mass loss over time is commonly quantified using negative exponential decay models. The amount of organic material remaining at any given point in time is expressed by the standard equation:
M = M₀e⁻ᵏᵗ
where M₀ represents the original mass of the litter, k denotes the annual decay rate coefficient (yr⁻¹), and t is the elapsed time in years.
The fraction of the original organic matter remaining after one year of decomposition simplifies to the ratio:
M / M₀ = e⁻ᵏ
A larger annual decay rate coefficient (k) corresponds to a faster mass loss and lower accumulation of surface organic litter. For instance, a coefficient of k = 1 indicates that approximately 37% of the original litter mass remains after one year, a rate characteristic of warm, humid tropical climates. Conversely, in cold high-latitude ecosystems, a typical rate coefficient is k = 0.1, leaving roughly 90% of the original litter mass un-decomposed after one year.
Environmental Drivers: Temperature and Soil Moisture Controls. The overall rate of decomposition operates as a direct function of soil temperature and soil moisture content. Organic material degrades significantly faster in warm soils than in cold soils because microbial enzymatic activity accelerates with rising temperatures.
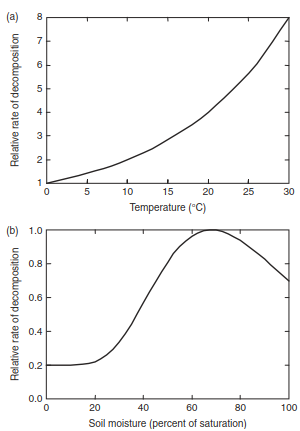
Fig. 21.2. Generalized effect of (a) temperature and (b) soil moisture on decomposition. From a terrestrial ecosystem model (Raich et al. 1991; McGuire et al. 1992).
As illustrated in Fig. 21.2a, the relative rate of decomposition approximately doubles for every 10 °C increase in soil temperature within normal physiological limits. However, moisture availability acts as an equally critical limiting factor. In extremely dry soils, insufficient water availability inhibits microbial metabolic growth and enzyme diffusion. Conversely, excessively saturated soils restrict oxygen diffusion, creating anaerobic conditions that reduce optimal microbial activity. As shown in Fig. 21.2b, maximum decomposition rates typically occur when soil moisture reaches approximately 70% of saturation.
Chemical Quality of Plant Litter and Decay Kinetics. Beyond abiotic factors, the intrinsic chemical quality of plant litter governs decomposition velocity. Substrates rich in essential nutrients support higher microbial biomass production and activity, thus decomposing more rapidly than nutrient-poor litter.
Two primary indices are utilized to evaluate litter quality:
1. Carbon-to-Nitrogen Ratio (C:N): Plant debris exhibiting a high C:N ratio decomposes significantly slower than debris with a low C:N ratio.
2. Lignin-to-Nitrogen Ratio (lignin:N): Lignin is a complex structural polymer that provides mechanical rigidity to woody plant tissues. It is particularly abundant in leaves, stems, and wood, making it one of the most decay-resistant plant compounds.
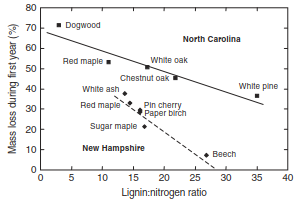
Fig. 21.3. Relationship between mass loss during the first year of decomposition and initial concentrations of lignin and nitrogen in leaf litter for six tree species in New Hampshire and five tree species in North Carolina. Data from Melillo et al. (1982).
Mass loss during the initial year of decay exhibits an inverse relationship with the initial lignin:N ratio of foliage, as shown in Fig. 21.3. In the warm climate of North Carolina, red maple (Acer rubrum) and dogwood (Cornus florida)—which possess low lignin:N ratios—lose more than 50–70% of their original mass in one year. In contrast, white pine (Pinus strobus) litter exhibits a high lignin:N ratio and loses less than 40% of its mass over the same period. Tree species such as white oak (Quercus alba) and chestnut oak (Quercus montana) display intermediate decay rates corresponding to their intermediate lignin:N ratios.
In the colder northern hardwood forests of New Hampshire, common species include red maple, pin cherry (Prunus pensylvanica), paper birch (Betula papyrifera), white ash (Fraxinus americana), beech (Fagus grandifolia), and sugar maple (Acer saccharum). For similar lignin:N ratios, decay rates are consistently lower in New Hampshire than in North Carolina, highlighting the thermal inhibition of decomposition in colder environments.
On average, the lignin:N ratio in foliage averages 33 for temperate needleleaf evergreen trees and 17 for temperate broadleaf deciduous trees. Corresponding C:N ratios average 64 and 46, respectively (Brovkin et al. 2012). Consequently, foliage litter from broadleaf deciduous species is of higher chemical quality and decomposes significantly faster than that of needleleaf evergreen trees.
Stoichiometry of Immobilization and Mineralization. When plant detritus falls onto the soil surface, nutrients such as nitrogen are released as the litter breaks down. However, this nitrogen is not immediately available for uptake by plant root systems. Soil microbes require nitrogen at specific stoichiometric ratios to synthesize cellular structures and sustain growth.
During early stage decay, microbial demand for nitrogen often exceeds the supply contained within the decaying litter itself. To satisfy this demand, microorganisms assimilate inorganic nitrogen from the surrounding soil matrix and incorporate it into microbial biomass. This process, termed immobilization, leads to a net absolute increase in nitrogen within the decomposing litter mass while temporarily reducing the pool of plant-available soil nitrogen.
As decay progresses and carbon is lost through microbial respiration, microbial nitrogen demand decreases. Once nitrogen release through catabolism exceeds microbial assimilation demand, net mineralization occurs, enriching the soil with inorganic nitrogen forms available to plants. Typically, fresh litter characterized by a high C:N ratio drives immobilization, whereas fully humified organic matter with a low C:N ratio drives mineralization.
Quantitative Stoichiometric Example. Consider the decomposition of 100 g of carbon in plant litter:
· Initial Litter Parameters: Assume a C:N ratio of 25:1. The total nitrogen in the substrate equals 4 g N (calculated as 100 g C / 25 g C g⁻¹ N). This total represents gross mineralization.
· Microbial Biomass Parameters: Assume a microbial C:N ratio of 10:1 and a microbial growth efficiency (MGE) of 0.4 (where MGE represents the fraction of assimilated carbon converted into microbial biomass, with the remaining 0.6 respired as CO₂).
· Assimilation Dynamics: Decomposing 100 g of litter carbon yields 40 g of microbial biomass carbon (100 g C × 0.4). To construct this biomass at a 10:1 ratio, microbes require 4 g N (calculated as 40 g C / 10 g C g⁻¹ N).
· Net Balance:
o Gross Mineralization = 4 g N
o Immobilization = 4 g N
o Net Mineralization = Gross Mineralization - Immobilization = 0 g N
If the initial litter C:N ratio exceeds 25:1, immobilization requirements exceed gross mineralization, resulting in negative net mineralization. Conversely, net mineralization is positive when the initial litter C:N ratio is less than 25 (< 25).
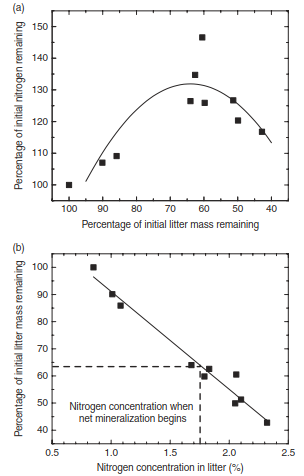
Fig. 21.4. Decomposition and nitrogen dynamics of yellow birch leaves. (a) Relationship between nitrogen content in the remaining litter (as a percentage of original nitrogen content) and remaining litter mass. (b) Relationship between litter mass (as a percentage of original mass) and nitrogen concentration in the remaining litter. Data from Aber and Melillo (1980).
Empirical data from Aber and Melillo (1980) on yellow birch (Betula alleghaniensis) leaf litter illustrate these stoichiometric dynamics (Fig. 21.4). As litter mass decreases from 100% down to 64%, total nitrogen content relative to the initial baseline increases due to immobilization (Fig. 21.4a). Continued decay beyond this point initiates net nitrogen release. Throughout this process, as leaf litter mass decreases, nitrogen concentration in the remaining residue increases linearly from an initial 0.85% to 2.3% (Fig. 21.4b). Net mineralization commences when approximately 36% of original mass is lost (at 64% remaining mass), corresponding to a nitrogen concentration of ~1.75%, where roughly 7.4 mg of nitrogen has been immobilized per gram of decayed litter.
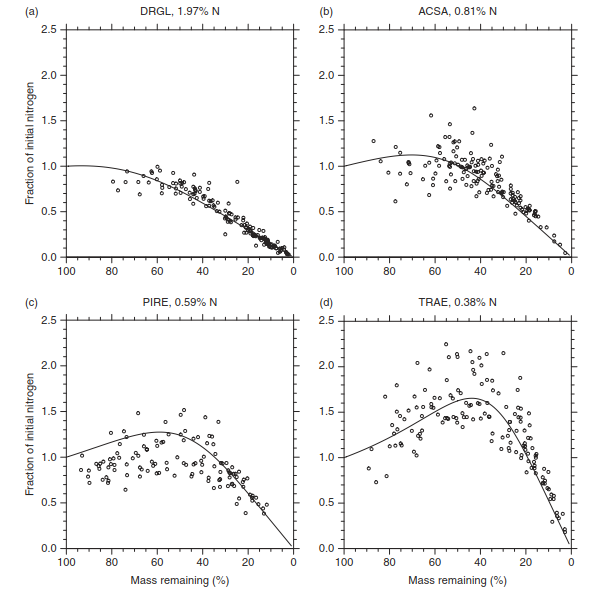
Fig. 21.6. Fraction of initial nitrogen remaining in relation to carbon mass remaining for (a) Drypetes glauca (DRGL), (b) Acer saccharum (ACSA), (c) Pinus resinosa (PIRE), and (d) Triticum aestivum (TRAE) leaf litter decomposed at tundra, forest, and humid grassland sites. These litter types varied in initial nitrogen concentration, from 0.38 percent N (TRAE) to 1.97 percent N (DRGL). Shown are the observations (open symbols) and the best-fit equation for the observations (solid lines). Data from Parton et al. (2007).
Cross-biome litterbag studies confirm these stoichiometric principles across global climate zones (Gholz et al. 2000; Parton et al. 2007; Harmon et al. 2009). As depicted in Fig. 21.6, litter with high initial nitrogen content, such as Drypetes glauca (1.97% N), exhibits minimal nitrogen immobilization and proceeds rapidly to net mineralization. Conversely, nitrogen-poor substrates like Triticum aestivum (0.38% N) immobilize substantial external nitrogen, delaying net mineralization until nearly 60% of total carbon mass has been respired.
Cross-Biome Patterns and Long-Term Carbon Accumulation. Long-term multi-site decay experiments across North and Central America demonstrate that geographic variations in air temperature, precipitation, and potential evapotranspiration dictate regional decomposition rates.
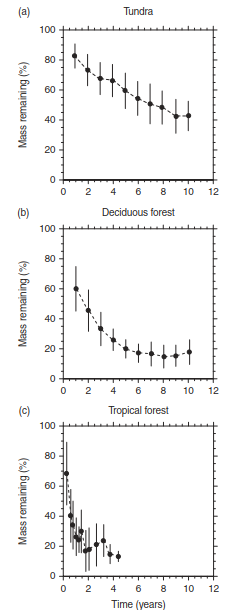
Fig. 21.5. Average litter mass remaining (as a percentage of original mass) in relation to time for leaf litter decomposed at different sites. Data are averaged across six leaf litter types for sites classified as (a) tundra (n = 2 sites), (b) deciduous forest (n = 3 sites), and (c) tropical forest (n = 3 sites). Shown are the observations (symbols) with ± 1 standard deviation. Data from Parton et al. (2007).
As shown in Fig. 21.5, overall mass loss over 10 years is lowest in arctic tundra ecosystems, intermediate in temperate deciduous forests, and highest in tropical rainforests.
As decomposition proceeds over decadal to centennial timescales, residual organic matter becomes increasingly recalcitrant. This decay-resistant fraction accumulates within the soil profile, contributing to pedogenesis over 1,000 to 10,000 years at rates ranging from 0.2 to 12 g C m⁻² yr⁻¹. Cold, wet conditions promote maximum organic matter accumulation (Schlesinger 1990), with arctic soils holding in excess of 15 kg C m⁻², compared to warmer climates which often store 6–9 kg C m⁻².
Soil Organic Matter Models: Structure of the CENTURY Model. To capture these complex dynamics, mathematical frameworks such as the CENTURY model (Parton et al. 1987, 1988, 1993, 1994) conceptualize litter decomposition and soil organic matter (SOM) formation across distinct carbon pools governed by unique base turnover rates.
In the CENTURY model, incoming plant litter is partitioned into metabolic or structural pools based on initial lignin:N ratios. Base decomposition rates are continuously adjusted according to site-specific abiotic variables, including soil temperature, moisture, pH, and texture. Each carbon pool maintains a corresponding organic nitrogen pool, where nitrogen mineralization or immobilization acts dynamically to maintain the strict stoichiometric C:N constraints required by target receiver pools.
Date added: 2026-09-24; views: 1;