
Soil Gaseous Nitrogen Dynamics and Soil Profile Stratification
The biogeochemical cycling of nitrogen in terrestrial ecosystems involves dynamic pathways of transformation, gaseous exchange, and deep pedogenic stratification. Understanding how gaseous emissions fluctuate with abiotic drivers and how soil horizons stratify organic matter provides essential context for global biogeochemical and environmental assessments.
1. Mechanisms of Soil Gaseous Nitrogen Emissions. The mineralization of organic nitrogen is accompanied by the release of diverse gaseous nitrogen compounds—including ammonia (NH₃), nitric oxide (NO), nitrous oxide (N₂O), and dinitrogen (N₂)—from soils into the atmosphere (as illustrated in Figure 20.12).
Ammonia Volatilization Dynamics. The inorganic ammonium ion (NH₄⁺) and gaseous ammonia (NH₃) remain in reversible chemical equilibrium within the soil solution through the following chemical reaction:
NH₄⁺ + OH⁻ ⇌ NH₃ + H₂O (21.5)
The loss of gaseous NH₃ to the surrounding atmosphere is termed ammonia volatilization. Under unmanaged natural soil conditions, this pathway of nitrogen loss remains comparatively low due to limited substrate NH₄⁺ concentrations. However, volatilization becomes a major pathway in agricultural environments enhanced by synthetic fertilizers, animal manure applications, and livestock feedlot operations. Key environmental drivers controlling the rate of ammonia volatilization include soil temperature, soil moisture, pH, and surface wind speed.
Nitrification and Denitrification Pathways. Microbial transformations of nitrogen proceed through distinct aerobic and anaerobic pathways:
· Nitrification: An obligate aerobic oxidation process requiring elevated dissolved oxygen concentrations, where NH₄⁺ is converted to nitrate (NO₃⁻). Trace quantities of NO and N₂O are produced as metabolic byproducts during this pathway.
· Denitrification: An anaerobic reduction pathway taking place in oxygen-depleted, wet soils, where NO₃⁻ is reduced sequentially to N₂, generating intermediate byproducts of NO and N₂O.
2. Theoretical Modeling: The Hole-in-the-Pipe Framework. To conceptualize and predict gaseous flux dynamics, Firestone and Davidson (1989) and Davidson (1991) developed the hole-in-the-pipe model (as shown in Fig. 21.8).
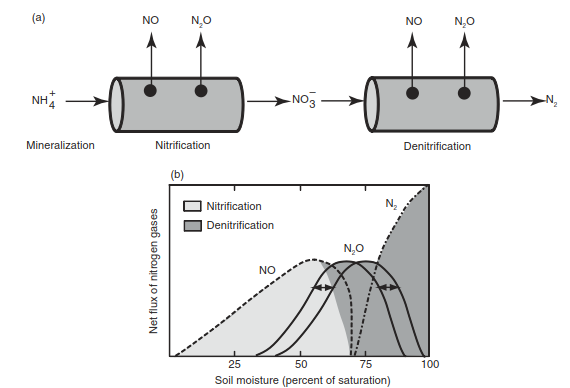
Fig. 21.8. Diagram of the hole-in-the-pipe model of nitrogen trace gas production. (a) The rate of flow of nitrogen through the pipes during nitrification and denitrification determines the gaseous losses. (b) Soil water content affects the proportion of gas losses as NO, N₂O, and N₂, conceptualized as the relative size of the holes through which NO and N₂O leak. Adapted from Bouwman (1998) and Davidson et al. (2000).
Environmental Drivers of Gas Leakage. In this model, the overall flow rate of nitrogen through the conceptual "pipe" corresponds directly to total nitrification and denitrification rates. Gaseous NO and N₂O emissions represent small fractional leaks exiting through "holes" along the pipe.
Soil moisture serves as the primary regulator controlling the relative diameter of these holes:
1. Moist Soils (30–60% Water Saturation): Aerobic conditions promote the oxidative process of nitrification, making NO the predominant gas produced.
2. Wetter Soils: Anaerobic microsites develop, shifting dominant emissions toward N₂O via denitrification.
3. Fully Saturated Soils: Oxygen becomes severely depleted, causing denitrifying microbes to further reduce most N₂O into inert N₂ gas prior to atmospheric escape.
3. Global Nitrogen Gas Emission Budgets. Using stable nitrogen isotope analysis (¹⁵N/¹⁴N), Bai et al. (2012) estimated global gaseous nitrogen fluxes across natural and managed biomes. Globally, denitrification accounts for approximately 35% of total nitrogen losses in natural ecosystems, emitting a total of 47 Tg N yr⁻¹.
Global Gaseous Nitrogen Fluxes. Table 21.4 summarizes atmospheric nitrogen gas contributions partitioned by natural and agricultural origins.

Table 21.4. Global nitrogen gas emissions (Tg N yr⁻¹). (Note: Natural sources are derived from isotopic nitrogen analyses [¹⁵N/¹⁴N], presenting mean values and ranges. Agricultural sources reflect synthesis from literature surveys. Source: Adapted from Bai et al., 2012).
Tropical terrestrial ecosystems generate the highest gaseous fluxes worldwide due to warm ambient temperatures and high soil moisture regimes that optimize microbial metabolism. Anthropogenic agricultural expansion and synthetic fertilizer application further amplify global NO and N₂O fluxes. Conversely, leaching accounts for 65% of total nitrogen losses globally, exhibiting higher proportional losses in extra-tropical regions than in tropical zones.
4. Pedogenic Horizons and Soil Profile Architecture. The cumulative effects of biological turnover, chemical weathering, and hydrological movement produce distinct structural layers, termed soil horizons, within a vertical soil profile (as shown in Fig. 21.9).
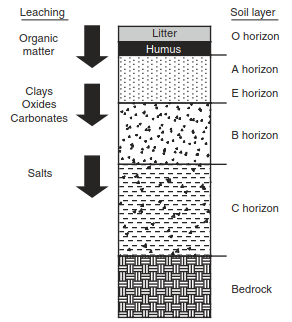
Fig. 21.9. General soil profile showing the primary soil horizons. Arrows on the left depict the downward leaching of materials.
Horizon Definitions and Functions
1. O Horizon (Organic Layer): Composes the surface organic debris layer. The uppermost portion contains undecomposed leaves, twigs, and branches (litter layer), transitioning downward into a humus layer of highly decomposed, unrecognizable organic material. This horizon can reach several centimeters in thick forest floors but is largely absent in grasslands.
2. A Horizon (Topsoil): The uppermost mineral soil layer enriched with organic matter migrating from above. It represents the zone of greatest physical, chemical, and biological activity, housing most plant roots, soil microbes, and organic carbon.
3.E Horizon (Eluvial Zone): Characterized by maximum leaching (eluviation) driven by percolating rainwater. Soluble silicate clays, iron, and aluminum oxides are leached deeper, leaving a concentrated residue of resistant minerals like quartz in sand and silt fractions.
4. B Horizon (Subsoil/Illuvial Zone): An accumulation zone receiving materials leached from overlying layers. It collects translocated silicate clays, iron and aluminum oxides, and secondary mineral precipitates like calcium carbonate and gypsum.
5. C Horizon (Parent Material): Deepest soil layer consisting of weathered rock fragments from which upper profile layers derive. It exhibits minimal influence from active pedogenic processes.
6. Bedrock: The solid unweathered geologic formation underlying the soil profile.
5. Vertical Soil Organic Carbon Distribution. As detailed in Figure 21.10, soil organic carbon (SOC) exhibits a marked vertical gradient across biomes.
Depth-Based Storage Comparisons
- Top 20 cm Depth: Holds 50% of total first-meter SOC in forest ecosystems and 42% in grassland ecosystems.
- 20–100 cm Depth: Contains 50% of first-meter forest SOC and 58% of first-meter grassland SOC.
- Deep Carbon Pools (2–3 Meters Depth): Forest soils store an additional carbon mass equal to 56% of their top-meter inventory within the second and third meters. In grassland biomes, this deep carbon pool equals 43% of the top-meter stock.
Understanding these deep carbon reserves is critical for assessing global carbon sequestration capacity and climate-soil feedback loops.
Date added: 2026-09-24; views: 2;