
Plant Succession and Ecosystem Recovery Dynamics
Foundational Mechanics of Ecological Succession. Plant succession refers to temporal change in community composition and ecosystem structure following disturbance. It is a progressive change in dominance by particular groups of species, biomass accumulation, and nutrient cycling over periods of several decades to centuries. Colonization of new land not previously vegetated is known as primary succession. This occurs in response to volcanic eruptions, alluvial deposits along floodplains, formation of sand dunes, and melting of glaciers. In contrast, secondary succession is the regrowth of vegetation on previously vegetated land following a disturbance such as fire, windthrow, logging, or farm abandonment. Succession is an integral part of forest stand dynamics and the response of forests to environmental change, but also occurs in grasslands and other herbaceous communities (Bormann and Likens 1979; West et al. 1981; Shugart 1984, 1998; Botkin 1993).
Change in community composition is accompanied by changes in the environment caused by plants themselves. For example, the development of a dense canopy shades the understory, litter accumulates on the forest floor, and nutrient cycling is altered based on the amount and chemical quality of plant detritus. These changes can facilitate the establishment of other species, abetting the directional change in dominance, or inhibit the establishment of new species. Succession driven by environmental change caused by plants is known as autogenic succession. In contrast, allogenic succession is driven by external factors (e.g., climate change) that cause the environment to change.
Lake Michigan Sand Dunes. The growth of vegetation on sand dunes along the Indiana shoreline of Lake Michigan near Chicago is a classic example of primary succession (Cowles 1899; Olson 1958). The changing shoreline of Lake Michigan during and after glacial retreat from the last ice age left several distinct beach and dune systems exposed above lake level. Dunes are progressively older with distance from shoreline, and the vegetation of these dune systems provides a record of succession. In general, young sand dunes are covered by herbaceous annuals and perennials and woody shrubs. Pine trees and then broadleaf deciduous trees become progressively more abundant on older dunes. This vegetation change from exposed sand dune to forest occurs relatively rapidly over a few hundred years. The growth of trees results in rapid accumulation of fresh and decomposed litter accompanied by an increase in soil nitrogen and cation exchange capacity.
Successional change in community composition depends on site conditions. The most prominent pathway is a change from grasses to pine to oak (Figure 22.4). Grasses are the most abundant pioneer vegetation on newly exposed dunes, occurring in pure stands or in mixtures. Woody plants such as cottonwood trees and sand cherry shrubs may become established depending on seed availability. This primary vegetation builds up and then stabilizes the dunes, allowing for subsequent invasion of jack pine and eastern white pine trees. Various types of black oak forests that differ in understory and ground cover eventually replace the short-lived pine trees. Pioneer herbs and shrubs rapidly decline in abundance with the growth of trees several decades following dune formation. Pine declines to a minor species after the first generation or two, being replaced by black oak, which remains dominant on even the oldest dunes.
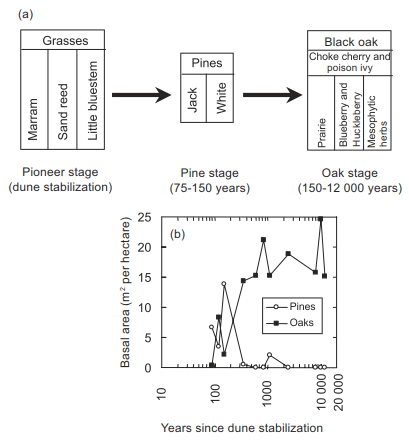
Fig. 22.4. Principal successional pathway on sand dunes along the southern shoreline of Lake Michigan. (a) Changes in community composition. (b) Tree basal area in relation to dune age. Basal area is the area of tree stems, typically at a height of about 1 m. Adapted from Olson (1958).
Alternative successional pathways are possible depending on soil moisture. Wet depressions may develop into a tall grass prairie or red maple swamp forest. Succession from basswood to northern red oak to sugar maple without usually passing through pine and black oak stages occurs on leeward slopes and depressions, where the microclimate is more moderate and moisture accumulates.
Glacier Bay, Alaska. The establishment of vegetation following deglaciations at Glacier Bay in southwestern Alaska is another classic example of primary succession (Cooper 1923a,b,c, 1931, 1939; Chapin et al. 1994; Fastie 1995). Since about 1750, a large glacier that once covered the inlet has rapidly retreated at a rate averaging 400 m per year. Some 2500 km² of ice has melted, exposing several hundred square kilometers of glacial till and outwash along the shoreline of Glacier Bay to plant colonization. Four major successional stages characterize the growth of vegetation following deglaciation (Figure 22.5):
· 1st stage: Pioneer stage (5–10 years since deglaciation) — Vegetation consists of blue-green algae, lichens, liverworts, and forbs. Soil depth is 5.2 cm, soil carbon is 1.3 kg m⁻², soil nitrogen is 3.8 g m⁻², pH is 7.2, and litterfall is 2 g m⁻² yr⁻¹.
· 2nd stage: Dryas stage (35–45 years since deglaciation) — Vegetation consists of Dryas, scattered willow, cottonwood, alder, and spruce. Soil depth is 7.0 cm, soil carbon is 1.3 kg m⁻², soil nitrogen is 5.3 g m⁻², pH is 7.3, and litterfall is 3 g m⁻² yr⁻¹.
· 3rd stage: Alder stage (60–70 years since deglaciation) — Vegetation consists of Sitka alder. Soil depth is 8.8 cm, soil carbon is 2.9 kg m⁻², soil nitrogen is 21.8 g m⁻², pH is 6.8, and litterfall is 278 g m⁻² yr⁻¹.
· 4th stage: Spruce stage (200–225 years since deglaciation) — Vegetation consists of Sitka spruce. Soil depth is 15.1 cm, soil carbon is 9.7 kg m⁻², soil nitrogen is 53.3 g m⁻², pH is 3.6, and litterfall is 261 g m⁻² yr⁻¹.
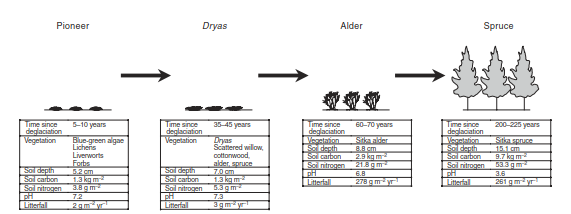
Fig. 22.5. Age, community composition, and average environmental characteristics of the four major successional stages following deglaciation at Glacier Bay, Alaska. Data from Chapin et al. (1994).
During the first 20 years or so after glacial retreat, pioneer vegetation consisting of blue-green algae, lichens, liverworts, and forbs colonize the exposed till. Scattered woody shrubs such as Dryas drummondii, a mat-forming shrub that fixes nitrogen, willows, and Sitka alder, another nitrogen-fixing shrub, and seedlings of black cottonwood and Sitka spruce trees may be present depending on proximity to seed sources. This pioneer community transitions to a Dryas stage after about 30 years following deglaciation. A continuous mat of Dryas, with scattered willow, alder, cottonwood, and spruce, covers the ground. About 50 years following deglaciation, alder increases in abundance to form dense thickets. The shorter Dryas, shaded and buried under deciduous leaf litter, does not grow well and disappears. Sitka spruce trees eventually overtop the alder, forming a needleleaf evergreen forest at about 100 years since glacial retreat.
Soils change markedly during this succession (Figure 22.5). Soil depth increases from 5 cm initially to 15 cm in mature spruce forests as a result of rapid weathering of glacial till. Soils in the pioneer stage have low soil carbon and nitrogen, high bulk density, low cation exchange capacity, and high pH. With the growth of woody vegetation and the deposition of litter, the soil becomes progressively enriched in carbon and nitrogen. Soils in spruce forests have high organic matter content, high nitrogen content, decreased bulk density, and low pH. The transition from Dryas to alder, an important nitrogen-fixing shrub, marks a four-fold increase in soil nitrogen and a decline in soil C:N ratio from 245:1 to 133:1. The soil C:N ratio then increases to 182:1 in the spruce forest because of the low litter quality of needles. Succession and soil development at Glacier Bay is rapid and comparable to rates observed during secondary succession, which might be because of its maritime climate, with moderate temperatures and high annual rainfall.
Old-Field Succession Patterns in the Piedmont Region. Old-field succession in the North Carolina Piedmont of Southeast United States is a classic example of old-field succession (Billings 1938; Oosting 1942; Keever 1950, 1983; Bormann 1953; Christensen 1977; Peet and Christensen 1980, 1987; Christensen and Peet 1981, 1984). Oak and hickory comprise the canopy of old-growth forests, with numerous smaller broadleaf deciduous tree and shrub species in the understory. Much of these old-growth forests were cleared in the 1700s and 1800s for agriculture. As the farms were abandoned, vegetation invaded the cleared fields, passing through distinct stages of herbaceous field and pine forest before becoming a mature oak-hickory forest (Table 22.1, Figure 22.6).
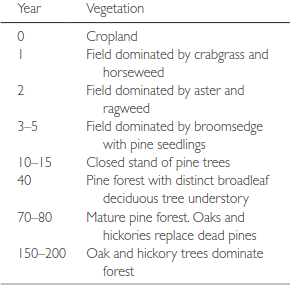
Table 22.1. Old-field succession following farm abandonment on upland sites in the North Carolina Piedmont. Source: From Billings (1938) and Oosting (1942).
Annual and perennial herbaceous species cover one- and two-year-old fields. The abundance of species declines in the third year as broomsedge, a perennial grass, increases in dominance. At about this time, seedlings of loblolly pine or shortleaf pine establish. Broomsedge maintains dominance for a few years until the rapidly growing pine seedlings overtop the shorter grasses, typically by the fifth year following abandonment. Closed stands of relatively even-aged pine trees form at 10 to 15 years. Germination and survivorship of pine seedlings declines in the low light under the closed canopy, maintaining the even age-structure of the stand.
Following canopy closure, stand dynamics is largely a result of growth and mortality of pine trees. By 40 years, a distinct broadleaf deciduous tree understory forms. By 70–80 years, the short-lived pine trees begin to die and the longer-lived oaks and hickories replace them in the canopy. Between about 150 and 200 years following abandonment, oak and hickory trees gain dominance and pines remain as scattered relics. The forest is uneven aged, with old, large oak and hickory trees in the canopy, abundant oak and hickory trees in understory, and a large number of smaller subordinate trees in the understory.
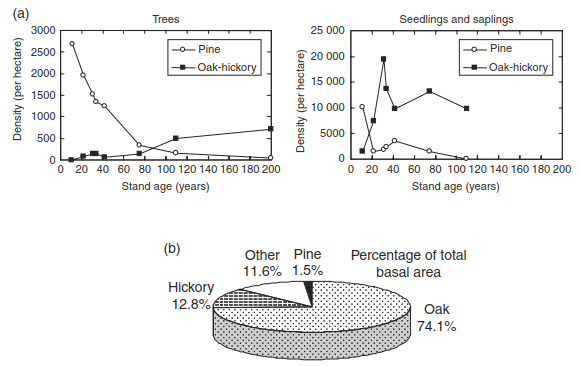
Fig. 22.6. Old-field succession on upland sites in the North Carolina Piedmont. (a) Density of pine, oak, and hickory trees (left) and seedlings/saplings (right) in relation to stand age. (b) Composition of a 200-year-old stand in terms of percentage of total basal area. Data from Billings (1938) and Oosting (1942).
Northern Hardwood Forest Dynamics and Biogeochemistry. The Hubbard Brook study provides a description of changes in community composition, biomass, and biogeochemical cycles during succession in northern hardwood forests of New England (Likens et al. 1977; Bormann and Likens 1979). During the first two to three years following clear-cutting, raspberry and blackberry (Rubus) flourish, complete their life cycles, and then decline in importance (Figure 22.7). These are replaced by pin cherry, a common early successional tree species restricted to recently disturbed forests. These trees grow fast and are short lived. Canopy closure occurs rapidly when large amounts of buried, viable seed form dense stands. Pin cherry dominates the canopy for the next several years. After about 25 to 35 years, sugar maple and American beech, which are tolerant of shade and able to survive beneath the dense pin cherry canopy, become dominant. Where pin cherry is less dense, it may be co-dominant with other fast-growing species such as yellow birch and quaking aspen. These longer-lived trees establish within the first few years following disturbance and dominate the canopy for several decades before the slower growing maple and beech trees reach canopy status.
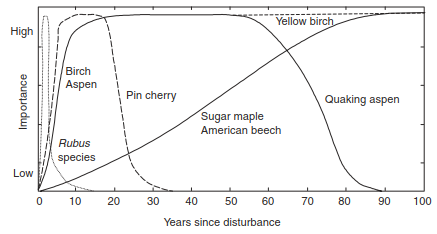
Fig. 22.7. Generalized changes in community composition following disturbance in a typical northern hardwood forest. Adapted from Marks (1974).
Biomass accumulation following clear-cutting generally has four phases (Figure 22.8). Reorganization is a period lasting about 10 to 20 years during which total biomass (living and detritus) decreases despite regrowth of vegetation. Loss of biomass from the forest floor and dead wood exceeds accumulation of biomass in plants. The aggradation phase is characterized by accumulation of biomass and nutrients in living plants, dead wood, and the forest floor. It begins about 15 years after clear-cutting and lasts for more than a century, culminating in peak accumulation of biomass. Accumulation of organic matter on the forest floor increases available water-holding capacity and cation exchange capacity. The transition phase is a period during which total biomass declines. At steady state, total biomass fluctuates around a mean value.
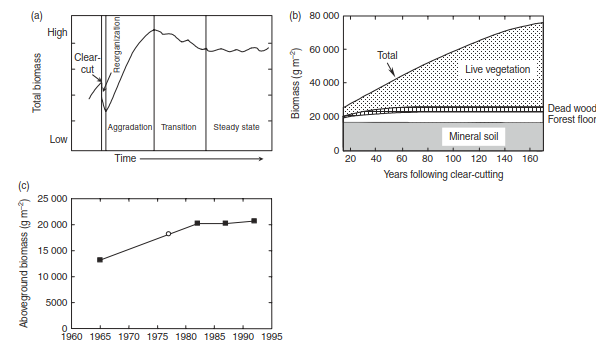
Fig. 22.8. Biomass accumulation following clear-cutting at the Hubbard Brook Experimental Forest. (a) General phases of ecosystem development. Adapted from Bormann and Likens (1979, p. 4). (b) General trends in biomass accumulation during aggradation. Adapted from Bormann and Likens (1979, p. 42). (c) Observed aboveground tree biomass for an undisturbed watershed in the Hubbard Brook Experimental Forest, 1965–1992. The data point for 1977 (open circle) is for trees with a diameter greater than 9.6 cm while all other years are for trees greater than 1.6 cm. Data from Likens et al. (1994). See also Fahey et al. (2005).
The reorganization phase begins immediately following clear-cutting. It is a period during which biotic regulation of hydrologic and biogeochemical cycles is lost. Deforestation eliminates or alters transpiration, nutrient uptake by plants, decomposition, and mineralization, processes that regulate the hydrology and biogeochemistry of an aggrading forest ecosystem. Loss of regulation is seen in increased export of water, nutrients, and sediments from the ecosystem. Comparison of forested and deforested watersheds at Hubbard Brook demonstrates regulation of the hydrologic and biogeochemical cycles by vegetation. After clearing in 1965–66, evapotranspiration decreased and streamflow increased in the deforested watershed compared with the forested watershed. The loss of vegetation resulted in a rapid increase in the concentration of dissolved nutrients and sediments in stream water (Figure 22.9). Elimination of nutrient uptake by plants and increased rates of decomposition in the warmer, deforested site caused nutrients to flush from the system. Recovery of biotic regulation is rapid following regrowth of vegetation. Much of this is related to the rapid colonization and growth of early successional species such as pin cherry.
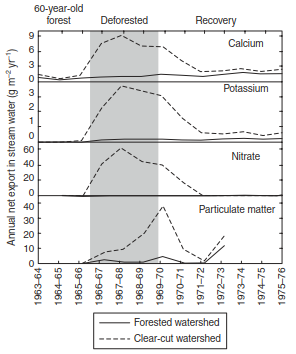
Fig. 22.9. Annual export of calcium, potassium, nitrate, and particulate matter in stream water for two watersheds in the Hubbard Brook Experimental Forest. One watershed was deforested in 1965–66 and vegetation regrowth was suppressed for three years. The other watershed was forested. Adapted from Bormann and Likens (1979, p. 149). See also Reiners (1992).
Fahey et al. (2005) describe idealized patterns of net ecosystem production during forest recovery from disturbance. The forest is a source of carbon to the atmosphere of about 500–1200 g C m⁻² yr⁻¹ during the first decade as biomass debris decomposes. By about 15–20 years following disturbance, the forest becomes a carbon sink as production exceeds decomposition. During the aggradation phase, carbon accumulates in vegetation and soil, and beginning at about 30 years following disturbance the forest is a moderate carbon sink of about 200–300 g C m⁻² yr⁻¹ for the next 30–40 years. This carbon sink declines beyond about 70 years age as the forest matures and steady state is achieved.
The Hubbard Brook study illustrates the decline in net primary production typically found in old stands (Figure 22.8c). The Hubbard Brook forest accumulated biomass at a rate of 485 g m⁻² yr⁻¹ between 1965 and 1997. Accumulation declined to 46 g m⁻² yr⁻¹ between 1982 and 1992. Living tree biomass has remained relatively constant, indicating biomass accumulation is nearly balanced by mortality and is near steady state (Fahey et al. 2005). Age-dependent decline in productivity is common in many forests (He et al. 2012).
Date added: 2026-09-24; views: 1;