
Ecosystem Succession Dynamics and Biosphere-Atmosphere Coupling
Successional Dynamics and Biosphere-Atmosphere Coupling. The successional development of ecosystems alters biosphere-atmosphere coupling. The post-fire successional development of boreal forests in North America illustrates temporal trends in surface energy fluxes. Amiro et al. (2006) presented measurements for 22 North American boreal forest sites initiated by wildfire and comprising grasses, herbs, and willow, aspen, jack pine, and black spruce trees depending on age. The 150-year forest chronosequence shows a marked change in albedo as the forests recover from fire (as shown in Fig. 22.15).
The general trend is a decline in albedo as the forest recovers. Summer albedo immediately following fire is low (~0.05) because of charring, but increases to about 0.12 with a deciduous canopy for a 30-year period, and then decreases to about 0.08 for mature spruce forest. Winter albedo has a pronounced decline from about 0.7 for young forests with a sparse canopy to about 0.2 for mature forests with a dense canopy. The evaporative fraction (λE / Rₙ) is smallest (0.2) in very young stands, increases to about 0.6 in stands 10–30 years old, and declines to about 0.4 in older stands. The Bowen ratio (H / λE) is largest in very young sites (>2), decreases in stands 10–30 years old (0.5–1), and increases again in old stands (1–2).
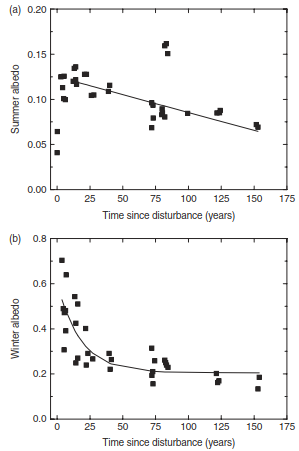
Fig. 22.15. Daily mean albedo during (a) summer and (b) winter in boreal forests of Alaska and western Canada in relation to time since disturbance. Adapted from Amiro et al. (2006).
Chronosequence Analysis of Energy Fluxes in Post-Fire Boreal Sites. Measurements at three sites in interior Alaska that differed in age since fire illustrate trends during post-fire black spruce succession (Liu et al. 2005; Liu and Randerson 2008). One site was a black spruce forest that had burned three years previously. The fire killed all vegetation, consumed much of the aboveground biomass, and removed a portion of the soil organic mat overlying the mineral soil. Three years following the fire, the boles of the dead trees remained standing, and 30 percent of the surface was covered by grasses and deciduous shrubs.
The second site was a black spruce forest that had burned 15 years previously. Fire killed all the vegetation, and many of the dead trees still stood. The site was revegetated by aspen and willow with a mean canopy height of 5 m. The third site was a black spruce forest that had burned 80 years previously and had regrown. Black spruce trees with a mean canopy height of 4 m formed the overstory. Moss and soil organic matter formed a forest floor that was 11 cm thick on average.
The three sites differed in energy fluxes (as shown in Table 22.4). Annual net radiation declined by 31 percent for the 3-year site and the 15-year aspen forest compared with the 80-year black spruce forest. This difference was greatest during spring because increased snow cover at the younger sites resulted in increased surface albedo. The summer and winter seasons also had substantial decreases in net radiation at the 3-year and 15-year sites relative to the 80-year black spruce forest. Overall, more than 50 percent of the annual decrease in net radiation at both younger sites occurred in spring, 20–33 percent occurred in summer, and less than 20 percent occurred during winter. Annual sensible heat flux decreased by more than 50 percent compared with the 80-year site. Similar to net radiation, most of this reduction occurred in spring.
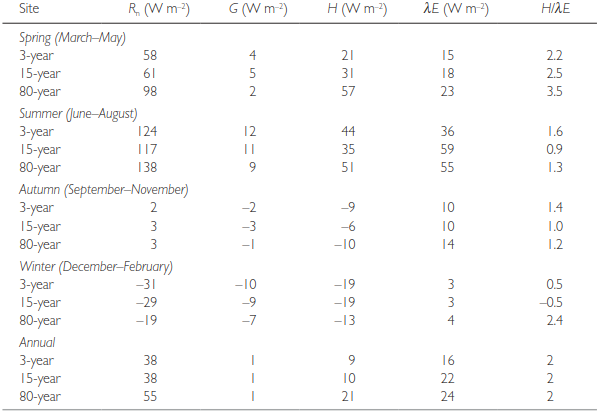
Table 22.4. Seasonal and annual net radiation (Rₙ), soil heat flux (G), sensible heat flux (H), latent heat flux (λE), and midday Bowen ratio (H / λE) for three sites in interior Alaska following fire. Source: From Liu et al. (2005).
Evapotranspiration Regimes and Canopy Conductance Shifts. Annual evapotranspiration at the 3-year site (202 mm yr⁻¹) was 33 percent less than the 80-year black spruce forest (301 mm yr⁻¹), but the 15-year aspen forest (283 mm yr⁻¹) had similar annual evapotranspiration compared with the black spruce forest. Differences in energy fluxes among the three sites were due in part to the increased surface albedo of the younger sites. Spring differences were largely attributable to the increased surface albedo of the younger sites arising from snow cover. As the snow melted, the midday albedo of the 3-year site declined from 0.7 to 0.1, comparable to that of the 80-year black spruce forest. During summer, the 3-year site had higher midday albedo (0.12) than the 80-year site (0.08).
The deciduous canopy at the 15-year aspen forest also influenced surface fluxes. The emergence of leaves on aspen trees in spring increased latent heat flux by 50 percent in the three-week period after leaf emergence compared with the three weeks prior to leaf emergence and decreased midday Bowen ratio from 1.9 to 1.2. During summer, the 15-year aspen forest had the highest latent heat flux, lowest sensible heat flux, and lowest midday Bowen ratio because of the high leaf area and canopy conductance of the deciduous overstory. Similar increases in latent heat flux with leaf emergence are seen in other deciduous forests, cooling regional climate.
Carbon Accumulation Mechanics and Net Primary Productivity Trends. Goulden et al. (2011) compared the carbon cycle along a 150-year forest chronosequence in central Manitoba (as shown in Fig. 22.16). The forest ecosystem accumulates carbon in live biomass and the forest floor with greater age. The ecosystem initially loses carbon (negative net ecosystem production) as respiration loss from decaying detritus exceeds carbon input from gross primary production.
Thereafter, as gross primary production recovers to predisturbance levels, the ecosystem gains carbon (positive net ecosystem production). Similar general patterns of substantial accumulation of carbon (and nitrogen) in forest ecosystems with age are common (Yang et al. 2011).
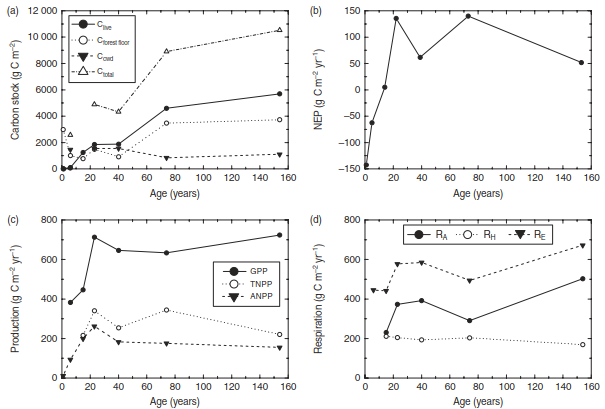
Fig. 22.16. Post-disturbance successional trends in the carbon cycle of boreal forests in central Manitoba, Canada. (a) Live biomass (C_live), forest floor (C_forest floor), coarse woody debris (C_cwd), and total (C_total) carbon stocks. (b) Net ecosystem production. (c) Gross primary production (GPP), total net primary production (TNPP), and aboveground net primary production (ANPP). (d) Autotrophic respiration (R_A), heterotrophic respiration (R_H), and ecosystem respiration (R_E). Data from Goulden et al. (2011).
Date added: 2026-09-24; views: 1;