
Wildfire Disturbances and Biosphere-Atmosphere Forcing
Wildfire Disturbance Regimes and Landscape Mosaic Dynamics. Fire is a common large-scale disturbance that shapes the structure and function of many forest, scrubland, and grassland landscapes. A study of fire in the Boundary Waters Canoe Area within the Superior National Forest along the United States–Canada border in northeast Minnesota illustrates the mosaic landscape created by fire (Heinselman 1973). Fire largely determined the composition and structure of this vegetation prior to European settlement. All of the forests in a 4170 km² study area burned one to several times in a 377-year period between 1595 and 1972.
Figure 23.4 illustrates the fire history for a 126 km² portion of the region. Ten fire-years occurred in this area, with the oldest dating to 1692. Fires in five years (1801, 1854, 1864, 1875, and 1910) were widespread and account for much of the area burned. For the 4170 km² region as a whole, a natural fire cycle of about 100 years prevailed prior to settlement. This is the average time required to cumulatively burn an area equal to the entire study area.
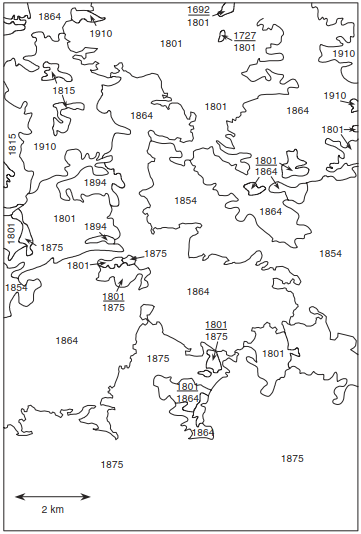
Fig. 23.4. Fire history of an approximately 9 km by 14 km region of the Boundary Waters Canoe Area, Minnesota. Stands date from after the indicated fire year. Where two years are given, stands consist of two age classes dating from separate fires. Adapted from Heinselman (1973).
Evolutionary Adaptations and Global Fire Distribution. Fire is an important ecological force in the development of many plant communities. Recurring fires, both natural and human, are common to grasslands, Mediterranean vegetation, savanna, and many temperate and boreal forests. Various species of grasses, shrubs, and trees have evolved a life history in response to fire. For example, the cones of some pine and spruce trees do not open to release seeds until they have been heated by a crown fire. The rapid height growth and thick bark of some pine trees provides protection from ground fires. Fires are quite common in boreal needleleaf evergreen forests, where the natural fire cycle ranges from 50 to 200 years (Heinselman 1981; Kasischke and Stocks 2000).
Satellites can be used to detect the occurrence of fires worldwide. For example, the Global Fire Emissions Database (GFED4) provides estimates of burned area since 1995 (Giglio et al. 2013). The global annual area burned between 1997 and 2011 ranged from 3.0 to 3.8 million km² and averaged 3.5 million km². Some regions of Africa and Australia burn with a frequency approaching one year (as shown in Fig. 23.5). Africa, Southern Hemisphere South America, and Australia have the most area burned annually (as shown in Fig. 23.6).
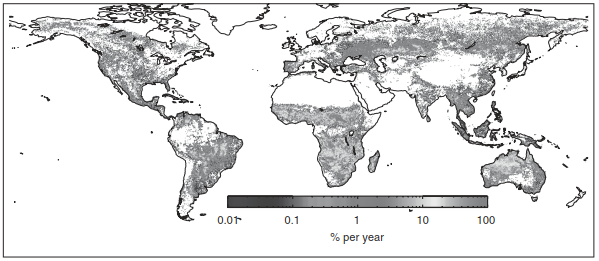
Fig. 23.5. Mean annual area burned for the period 1996–2012, expressed as the percentage of area. Reproduced from Giglio et al. (2013) and provided courtesy of Louis Giglio.
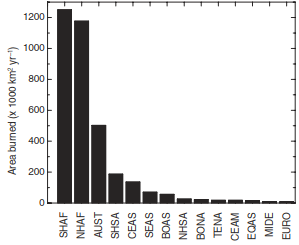
Fig. 23.6. Annual area burned for the period 1996–2011. Data from Giglio et al. (2013). Regions are: SHAF, Southern Hemisphere Africa. NHAF, Northern Hemisphere Africa. AUST, Australia. SHSA, Southern Hemisphere South America. CEAS, Central Asia. SEAS, Southeast Asia. BOAS, Boreal Asia. NHSA, Northern Hemisphere South America. BONA, Boreal North America. TENA, Temperate North America. CEAM, Central America. EQAS, Equatorial Asia. MIDE, Middle East. EURO, Europe.
Estimates of the fire return interval (biome area divided by annually burned area) for the 1990s are:
· boreal forest, 261 years;
· temperate forest, 138 years;
· temperate grassland, 88 years;
· tropical savanna and grassland, 5 years;
· tropical forest, 34 years (Mouillot and Field 2005).
Atmospheric Carbon Emissions and Biogeochemical Forcing. Fires alter atmospheric composition through the emission of long-lived greenhouse gases (CO₂, CH₄, and N₂O), carbon monoxide (CO), oxides of nitrogen (NOₓ), nonmethane hydrocarbons, particulate matter, and aerosols during combustion (Crutzen and Andreae 1990; Andreae and Merlet 2001; Bowman et al. 2009). Estimates of the amount of carbon emitted to the atmosphere annually during fires varies depending on estimates of area burned, fuel load, combustion completeness, and emission factor. For example, Mouillot et al. (2006) estimated that 3.3 Pg C yr⁻¹ was emitted by biomass burning during the 1990s. Fifty percent of this carbon was emitted during the burning of savanna, 38 percent from tropical forests, and 6 percent each from boreal and temperate forests.
van der Werf et al. (2010) estimated that 2.0 Pg C yr⁻¹ was emitted over the period 1997–2009. Carbon emissions varied greatly from year-to-year, ranging from a low of 1.5 Pg C yr⁻¹ (2009) to a high of 2.8 Pg C yr⁻¹ (1998). Slightly over one-half (52%) of the global emissions were from Africa, 15 percent from South America, 10 percent from equatorial Asia, 9 percent from boreal regions, and 7 percent from Australia.
Biogeophysical vs. Biogeochemical Radiative Forcing Drivers. Fires influence radiative forcing through altered atmospheric composition (e.g., CO₂, CH₄, N₂O, ozone, and aerosols) and through changes in surface albedo. In addition to direct post-fire changes in albedo, biomass burning releases black and organic carbon aerosols to the atmosphere. Dirty snow from black carbon (soot) deposition has a lower albedo than pristine snow, which contributes to positive radiative forcing (Hansen and Nazarenko 2004; Flanner et al. 2007; Lee et al. 2013).
Randerson et al. (2006) contrasted the biogeochemical and biogeophysical consequences of fire in a black spruce forest in Alaska (as shown in Table 23.1). Long-lived greenhouse gases (CO₂, CH₄) emitted during combustion produce a positive annual radiative forcing in the first year following fire. Additional positive annual radiative forcing arises from ozone produced from trace gases emissions, black carbon deposited on snow and ice, and aerosols. The loss of forest overstory increases snow exposure, leading to higher surface albedo in spring and fall and negative annual radiative forcing.
The biogeochemical warming exceeds the biogeophysical cooling in the first year following fire. However, the effects of ozone, black carbon, and aerosols are short lived. The long-term radiative forcing is a balance between post-fire increases in surface albedo and the continued positive radiative forcing from the greenhouse gas pulse emitted to the atmosphere during burning. Averaged over an 80-year fire cycle, the negative radiative forcing from surface albedo exceeds the smaller positive biogeochemical radiative forcing.
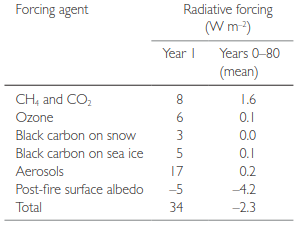
Table 23.1. Radiative forcing associated with wildfire in interior Alaska. Note: Radiative forcing is per m² of burned area. Source: From Randerson et al. (2006).
Date added: 2026-09-24; views: 1;