
Historical Dynamics of Land Use and Deforestation Dynamics
[Socioeconomic Drivers of American Deforestation]. Historical land-use trajectories in North America reveal profound transformations driven by European settlement, industrial development, and agricultural shifting. Much of the primary forests across the eastern United States and the grasslands of the Great Plains in the central United States have been systematically replaced with agricultural crops (as shown in Fig. 23.10) or converted into secondary forests (as shown in Fig. 23.11). The overarching land-use history of the United States remains fundamentally tied to European colonization and subsequent westward migration (Williams, 1989). In the early 1600s, European colonists encountered landscapes in New England and Virginia that were predominantly primary forests. Prior to European arrival, Native Americans cleared localized forest areas for villages, crop cultivation, and wood harvesting, while utilizing controlled burning techniques in woodlands to facilitate hunting activities (Williams, 1989, 2000, 2003).
Over the subsequent 200 to 300 years, extensive land clearing occurred to accommodate growing settlements, cropland expansion, and timber harvesting, progressing at a pace dictated by national socioeconomic growth (as shown in Fig. 1.2). Across most of the northeastern United States, accelerating rates of deforestation during the late 1700s culminated in peak forest clearing by the mid-1800s. Following this peak, widespread farm abandonment led to substantial recoveries in secondary forest cover across numerous regions. By 1900, intensive agricultural expansion and forest clearing had extended into the southeastern states, which similarly underwent secondary forest succession several decades later. This characteristic sequence of clearing followed by farm abandonment repeated in the Midwest and central Plains alongside westward population expansion. Between 1850 and 1992, approximately 1.7 million km² of savanna and grassland, together with 1.4 million km² of forest and woodland, were cleared for cultivation (Ramankutty and Foley, 1999b).
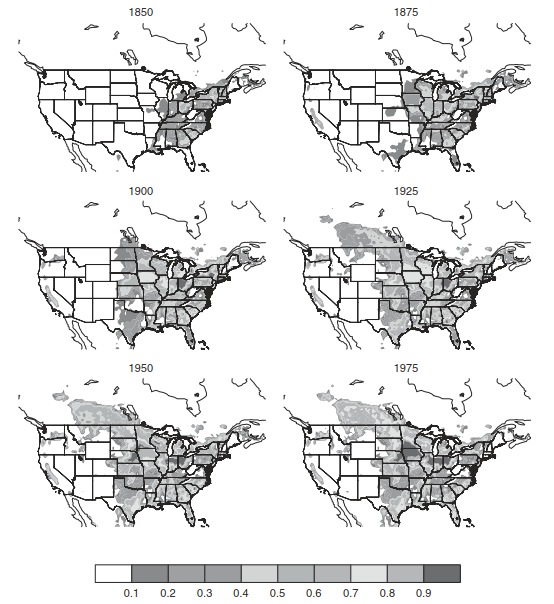
Fig. 23.10. Historical cropland area in the United States from 1850 to 1975 showing the fraction of the landscape covered in cropland.
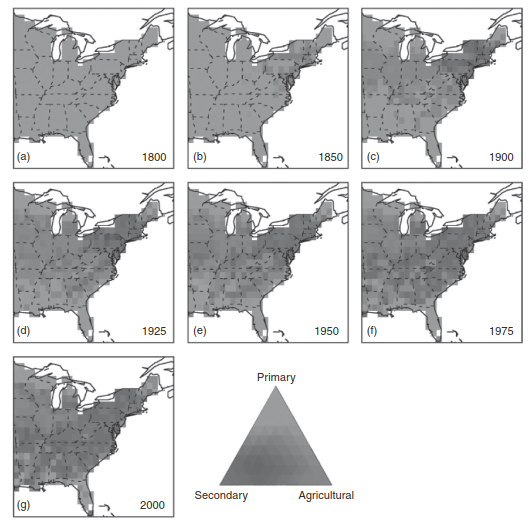
Fig. 23.11. Historical area of primary forest, secondary forest, and agricultural land in eastern United States, 1800–2000.
[Regional Trajectories of Deforestation in Central New England]. Detailed ecological and historical analyses of central New England provide a clear temporal framework for regional deforestation (Williams, 1989; Foster, 1992, 1993; Foster et al., 1992, 1998; Fuller et al., 1998). Presettlement forests consisted of complex, uneven-aged stands featuring a mixture of broadleaf deciduous and needleleaf evergreen species maintained by natural disturbance regimes, such as windthrow from severe hurricanes and natural gap dynamics. Deforestation initiated in earnest during the 1700s and accelerated rapidly through the early 1800s alongside widespread agricultural establishment. The period spanning 1795 to 1860 represented an intense landscape transformation, during which forests were extensively cleared for pasturelands, hay fields, agricultural crops, fuelwood, and industrial forest products. At the height of land clearing in the mid-1800s, upland areas throughout central New England retained less than 25% forest cover. Subsequent shifts toward urban center expansion, an industrial economy, and heavy reliance on coal reduced regional agricultural reliance, causing widespread farm abandonment and natural reforestation.
Case Study: Historical Forest Clearing and Recovery in Petersham and Prospect Hill. The forest history of the 380 ha Prospect Hill tract within Harvard Forest and the surrounding town of Petersham, Massachusetts, offers a representative model of New England landscape dynamics (Foster, 1992, 1993; Foster et al., 1992; as shown in Fig. 23.12a). Settled in 1733, early farmers in Petersham initially cleared less than 2 ha of forest annually per household for fuel, building materials, crop production, and livestock grazing. By the late 1700s, rapid regional population growth and improved transportation infrastructure spurred a commercial agricultural economy. In Petersham, clearing for sheep and cattle pastures expanded open agricultural land from 50% in 1800 to nearly 85% by 1850, creating a heterogeneous mosaic of small fields and isolated woodlots. Deforestation on the Prospect Hill tract closely mirrored municipal trends: clearing began around 1750, expanded gradually until 1780, and accelerated until peak deforestation occurred between 1840 and 1850, leaving approximately 20% forest cover.
Palynological records retrieved from lake sediment cores document significant shifts in community composition throughout this clearing and recovery cycle (Foster et al., 1992). Pollen abundances for major canopy species, including beech, maple, pine, oak, and eastern hemlock (Tsaoa canadensis), dropped sharply during the agricultural peak. Conversely, pollen counts for herbaceous Taxa associated with hay production, livestock grazing, and row crops increased dramatically. Chestnut (Castanea) pollen also increased due to its fast growth rates and prolific root-sprouting capabilities following logging disturbance. Reforestation efforts and natural succession commenced as early as the 1840s. In Petersham and across central New England, secondary forest growth on abandoned farmland catalyzed a brief timber industry in the late 1800s and early 1900s. Between 1885 and 1895, virtually all merchantable timber on Prospect Hill was harvested, after which farm abandonment and secondary succession resumed in earnest.
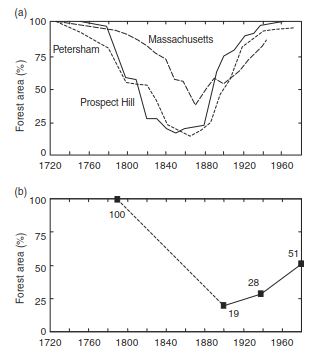
Fig. 23.12. Forest history of northeastern United States. (a) Percentage of land covered by forest in the Prospect Hill tract of the Harvard Forest in central Massachusetts, the town of Petersham, and the entire state. (b) Percentage of land covered by forest in Tompkins County, New York.
[Landscape Dynamics in Central New York and the Great Lakes Region]. A parallel trajectory of deforestation and natural recovery occurred in Tompkins County, a 1250 km² area located in the central Finger Lakes region of New York (Smith et al., 1993; as shown in Fig. 23.12b). Prior to European settlement, dense forests covered the region, with Native Americans maintaining small agricultural clearings. European settlement and rapid deforestation accelerated after 1790, reaching peak farmland coverage by 1900, when 81% of the land area was converted to agricultural fields or urban centers, leaving only 19% forested. Farm abandonment drove secondary forest expansion throughout the 20th century, with secondary forests covering 51% of the county by 1980. Although modern secondary forests match primary forests in structural canopy density and light availability, their compositional makeup differs significantly (Flinn and Marks, 2007). Primary forests were dominated by late-successional species like sugar maple (Acer saccharum) and American beech (Fagus grandifolia), whereas secondary forests are dominated by early- to mid-successional species such as red maple (Acer rubrum) and eastern white pine (Pinus strobus). While overall forest cover across the northeastern United States has recovered to approximately 80%, species composition remains fundamentally altered (Thompson et al., 1913).
Deforestation in the Great Lakes region occurred later but proceeded at an accelerated rate following rapid settlement west of the Appalachian Mountains in the mid-1800s. Agricultural conversion dramatically transformed forested landscapes across Michigan, Wisconsin, and Minnesota (Cole et al., 1998). For example, regions in Wisconsin that were entirely forested in 1831 retained only 30% forest cover by 1882, which dropped further to 10% by 1902 (Williams, 1989). Presettlement landscapes were dominated by mesic forests featuring sugar maple, yellow birch (Betula alleghaniensis), American beech, eastern hemlock, and basswood (Tilia americana), along with oak savannas (red oak, black oak, white oak, bur oak) and pine forests (white pine, red pine, jack pine). Boreal forests, aspen-birch stands, and lowland swamp forests were also prevalent. Overall forest area across these states decreased by 40%, driven largely by the conversion of mesic and oak forests to agricultural land (as shown in Fig. 23.13).
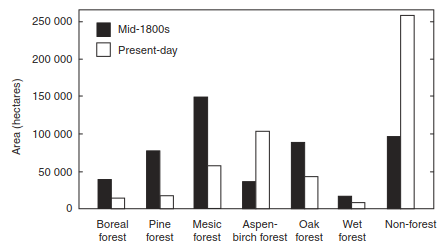
Fig. 23.13. Spatial extent of forest types in the Great Lakes states of Michigan, Wisconsin, and Minnesota in the mid-1800s and present-day.
Long-Term Structural Changes in Northern Wisconsin Stand Composition. Quantitative evaluation of a 9600 ha forested tract in northern Wisconsin illustrates the extent of structural and composition shifts triggered by timber harvesting and land clearance (White and Mladenoff, 1994). Old-growth stands dominated by eastern hemlock, white pine, sugar maple, and yellow birch characterized the pre-settlement landscape of 1860. Intensive land clearance, agricultural settlement, and severe post-logging fires between 1860 and 1931 decimated primary old-growth forests while encouraging second-growth establishment. Early post-disturbance stands were dominated by pin cherry (Prunus pensylvanica), aspen-birch mixtures, and northern hardwood complexes. Over subsequent decades, successional dynamics reorganized landscape composition into a mixed assemblage of boreal and northern hardwood stands (as outlined in Table 23.3).
· Presettlement Period (1860): Old-growth hemlock stands comprised 46% of the landscape, old-growth hardwood comprised 31%, and old-growth hemlock/hardwood mixtures comprised 22%.
· Peak Human Impact (1931): Old-growth hemlock declined to 7%, old-growth hardwood fell to 16%, and mixed stands disappeared completely. Second-growth pin cherry surged to 37% cover, accompanied by northern hardwood (19%) and boreal mixed hardwood (14%).
· Modern Period (1989): Old-growth hemlock decreased to 4%, and old-growth hardwood dropped to 2%. Second-growth cover stabilized into northern hardwood (30%), hardwood/conifer (29%), boreal mixed hardwood (22%), and mixed conifer (10%), while pin cherry dropped to 2%.
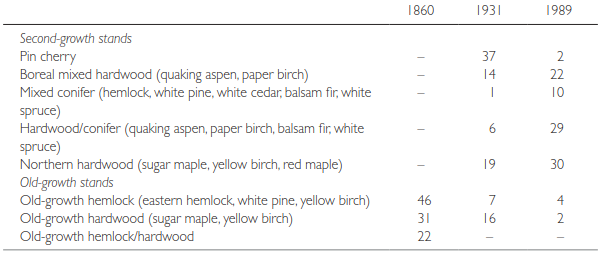
Table 23.3. Percentage area of upland forest types for a 9600 ha tract in northern Wisconsin at presettlement (1860), peak human activity (1931), and current (1989) periods. Source: From White and Mladenoff (1994).
[Patterns and Trends in Modern Tropical Deforestation]. Tropical broadleaf evergreen forests in the Amazon Basin of South America, the Congo Basin of Africa, and portions of Southeast Asia, Indonesia, and southeastern Australia constitute some of the most ecologically productive and biodiverse ecosystems on Earth. However, these systems face extensive clearing, burning, and agricultural conversion. Global estimates indicate that annual tropical forest loss during the 1990s reached 55,000 to 58,000 km² per year, with an additional 23,000 km² degraded annually (Achard et al., 2002; DeFries et al., 2002). The majority of modern tropical deforestation is concentrated in tropical South America and tropical Asia.
Drivers and Policy Mitigation in the Brazilian Amazon. In the Brazilian Amazon, forest clearing exerts a major influence on global climate dynamics and carbon cycle regulation. In the state of Rondônia, infrastructure expansion—including roads, government-sponsored settlement colonies, and forest reserve designations—dictates spatial land-clearing patterns (Skole and Tucker, 1993). Highway construction opened vast tracts of intact forest to development, producing distinct fishbone patterns of clearance. Between 1996 and 2005, deforestation rates in the Brazilian Amazon averaged 19,600 km² annually (as shown in Fig. 23.14). However, targeted governmental regulations, satellite monitoring, and policy enforcement subsequently reduced deforestation rates to historically low levels (Nepstad et al., 2009).
Date added: 2026-09-24; views: 1;