
Macroscale Plant Geography and Ecosystem Functioning in Global Biomes
Macroscale Ecological Dynamics and Planetary Interactions. Global climate dynamics fundamentally govern the structural configuration and compositional attributes of terrestrial vegetation across planetary scales. Environmental factors including temperature regimes and moisture availability direct ecosystem functioning at local scales while simultaneously establishing macroscale biogeographical distribution patterns. This climatic regulation extends directly to the global carbon cycle, establishing a direct functional coupling between terrestrial biophysical processes and planetary atmospheric dynamics.
The spatial distribution of global biomes demonstrates high statistical correlation with regional temperature patterns, annual precipitation totals, and potential evapotranspiration rates. Consequently, primary ecological fluxes—specifically annual net primary production (NPP) and organic matter decomposition rates—are dictated by these overarching climatic gradients. Long-term climate variations systematically shift biome boundaries and reorganize ecosystem metabolic functions. Global Biosphere Models provide a robust quantitative framework for analyzing planetary ecology and evaluating the precise mechanistic role of terrestrial ecosystems within the broader Earth climate system.
Biogeographical Patterns and Climatic Zonation. Macroscopic ecological complexity can be systematically conceptualized by grouping diverse terrestrial communities into fundamental macroscale biomes, such as forests, grasslands, shrublands, and deserts. The geographic distribution of natural vegetation exhibits a distinct zonation pattern that corresponds directly with global climate zones (as shown in Fig. 2.4). Principal biophysical zones—including tropical savanna, tropical rainforest, and tundra—are explicitly defined by their dominant plant growth forms (Table 6.1).
Tropical Evergreen Rainforests represent the dominant vegetation class in warm, humid equatorial regions across South America, Africa, Southeast Asia, and Indonesia. These ecosystems experience high year-round temperatures, abundant annual precipitation, and negligible seasonal thermal or moisture variations. High primary productivity characterizes these zones, where canopy trees frequently exceed 30 m in height to form dense broadleaf evergreen layers that attenuate incoming solar radiation. Sustained high temperatures and moisture levels create optimal metabolic conditions for rapid litter decomposition, preventing significant organic accumulation on the forest floor (Figure 6.1). In seasonal tropical regions characterized by distinct dry periods, tropical deciduous forests predominate; these drought-deciduous species shed foliage during moisture deficits, exhibiting reduced canopy density and stature relative to evergreen rainforest counterparts.
Photosynthetic Pathways and Grassland Dynamics. Grasses constitute the primary plant functional group across arid tropical and temperate regions. The metabolic distinction between C₃ and C₄ grasses is critical due to differences in photosynthetic carbon fixation pathways and water-use efficiency (WUE). C₃ plants dominate cooler terrestrial environments, whereas C₄ plants maintain functional dominance in warmer, high-light regions (Collatz et al. 1998; Still et al. 2003; Edwards et al. 2010).
· In dry tropical regions, closed forests transition into tropical savannas, characterized by widely spaced trees dispersed within continuous tall grass layers.
· Tropical savanna climates maintain warm temperatures year-round coupled with pronounced seasonal dry periods (Figure 6.2).
· Key adaptive strategies to severe moisture limitations include low total plant biomass, shortened vegetative stature, and deep rooting architectures.
· Periodic fire regimes represent a primary natural disturbance factor shaping community structure across these arid landscapes.
· Major geographical distributions of tropical savannas include areas north and south of the Amazon Basin, northern and southern regions of the Congo Basin, East Africa, and northern/eastern Australia.
Temperate Grasslands and Transitional Semi-Arid Biomes. Temperate grasslands develop in semi-arid regions experiencing hot summers, dry conditions, and annual precipitation below approximately 1000 mm (Figure 6.3). Prominent geographical formations include the prairies of the North American Great Plains, the Central Asian steppes, the Argentine pampas, and the South African veld. Grasslands represent a key ecological transition zone between humid forest biomes and arid desert systems.
Where annual precipitation declines further, short, widely spaced desert scrub and shrubland vegetation replace temperate grasses. Arid desert climates feature extreme thermal regimes with maximum daily temperatures frequently exceeding 40 °C and annual precipitation falling below 250 mm (with monthly rainfall occasionally under 5 mm; Figure 6.4). Desert floras exhibit specialized morphological and physiological adaptations to endure extreme water stress:
· 1st functional group: Winter annuals, which germinate in autumn or winter and flower in late spring following precipitation events.
· 2nd functional group: Summer annuals, which germinate in mid-summer and flower in late summer or autumn after heavy rains.
· 3rd functional group: Drought-deciduous shrubs, which shed leaves during prolonged dry spells to limit transpiration.
· 4th functional group: Evergreen shrubs, which sustain vegetative growth year-round despite ongoing water deficits.
· 5th functional group: Cacti and succulents, which utilize specialized water-storage tissues combined with the Crassulacean Acid Metabolism (CAM) photosynthetic pathway to minimize transpirational water loss.
Deserts occur primarily along the eastern flanks of subtropical high-pressure cells near 30° N and 30° S latitudes—including the southwestern United States, North Africa, southern South America, South Africa, and western Australia—as well as continental interiors isolated from moisture sources, such as Central Asia, central Australia, and the Great Basin.
Temperate Forests, Boreal Systems, and Mediterranean Biomes. Regions receiving annual precipitation in excess of 1000 mm support highly productive temperate forests composed of deciduous and evergreen tree species. These biomes cover eastern North America, the Pacific Northwest, central and southern Europe, and eastern China under humid subtropical, marine, or warm-summer humid continental climates (Figures 6.6–6.8). Long, warm summers and cool-to-cold winters drive pronounced biological seasonality. Forest canopies reach heights comparable to tropical forests, dominated by broadleaf deciduous species that drop leaves in winter, alongside needleleaf evergreen conifers.
Further north across Alaska, Canada, Northern Europe, and Russia, severe winter conditions and short, cool summers give rise to boreal forests (taiga). Characterized by cool-summer humid continental or subarctic climates (Figures 6.9 and 6.10), these cold landscapes display low annual primary production and slow organic decomposition. Vegetation is dominated by needleleaf evergreen conifers forming shorter, more open canopy structures than temperate forests. Similar high-latitude coniferous formations extend along high mountain ranges such as the Rocky Mountains, Cascade Mountains, and Sierra Nevada in Western North America, and the European Alps. In extreme continental environments like Siberia, cold-hardy deciduous needleleaf trees (e.g., Larix) predominate, shedding needles prior to extreme winter temperatures.
At high northern latitudes between 65° N and 70° N, boreal forests transition into treeless tundra ecosystems dominated by sedges, dwarf shrubs, lichens, and mosses. Tundra environments experience extremely low winter temperatures, a short growing season of two months or less, and permafrost conditions (Figure 6.11). Summer thaws affect only the upper 50 cm active layer of soil; cold, waterlogged substrate conditions severely constrain root development, biological productivity, and decomposition rates.
Chaparral (Mediterranean vegetation) constitutes a localized biome restricted to Mediterranean-climate regions, southern California, South Africa, and parts of southern Australia. These regions experience hot, dry summers paired with mild, moist winters (Figure 6.5). Consequently, vegetative growth occurs predominantly during winter months. Plants are characterized by short, dense woody shrubs with thick, waxy, evergreen leaves containing volatile oils that increase susceptibility to natural wildfire regimes.
Quantitative Bioclimatic Frameworks and Biome Determinants. Macroscale vegetation patterns are governed primarily by temperature and precipitation interactions (Figure 24.1). Temperature dictates reaction kinetics for essential physiological processes, whereas water availability provides the vital solvent matrix for plant tissues (comprising 80–90% of living plant mass). Environmental controls structure vegetation along two principal axes:
· Latitudinal gradient: Temperature decreases from tropical forest to temperate forest, boreal forest, and arctic tundra.
· Moisture gradient: Precipitation decreases from tropical rainforest to seasonal forest, savanna, and desert.
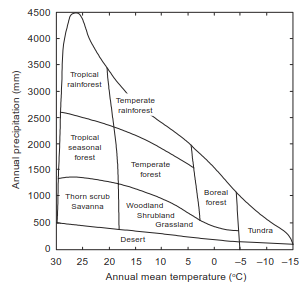
Fig. 24.1. Generalized relationships among major plant formations, annual mean temperature, and annual precipitation. Adapted from Whittaker (1975, p. 167).
Evapotranspiration serves as an integrated metric combining thermal energy and water availability. To maintain metabolic function, a standard C₃ plant loses approximately 1 liter of water via transpiration for every 1–5 grams of dry biomass produced (Table 16.2). Charles Thornthwaite demonstrated that potential evapotranspiration regulates geographical plant distribution (Thornthwaite 1948; Thornthwaite and Mather 1955, 1957). In tropical rainforests, high positive radiation balances drive elevated potential evaporation, requiring substantial annual precipitation to maintain positive water balance. Conversely, subarctic and tundra regions exhibit reduced evaporative demand due to lower thermal radiation, enabling vegetation maintenance under significantly lower annual precipitation regimes.
Mikhail Budyko quantified macroscale vegetation distribution by establishing the Radiative Dryness Index, defined as the ratio of annual net radiation (Rₙ) to the latent heat required to evaporate annual precipitation (λP):
· Radiative Dryness Index = Rₙ / λP (where λ represents the latent heat of vaporization).
· Values less than 0.3 correspond to tundra biomes (Figure 24.2).
· Values between 0.3 and 1.0 define forest vegetation, differentiated internally by absolute net radiation values.
· Values between 1.0 and 2.0 delineate grasslands (subdivided into steppe and prairie based on net radiation).
· Values between 2.0 and 3.0 denote semidesert environments.
· Values greater than 3.0 correspond to hyper-arid deserts.
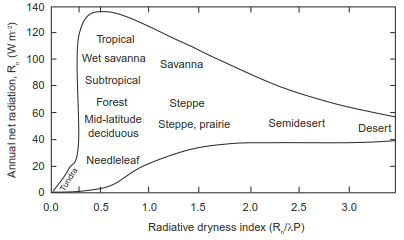
Fig. 24.2. Relationship of biomes with net radiation and radiative dryness index. This index is the ratio of net radiation to the amount of energy required to evaporate the annual precipitation (Rₙ / λP, where λ is the latent heat of vaporization). After Budyko (1974, p. 348).
Annual mean temperature, precipitation, and evapotranspiration form the baseline variables for global biogeographical classifications, including the BIOME model (Prentice et al. 1992; Haxeltine and Prentice 1996; Kaplan et al. 2003). The Holdridge Life Zone Classification System epitomizes these bioclimatic modeling schemes (Figure 24.3).
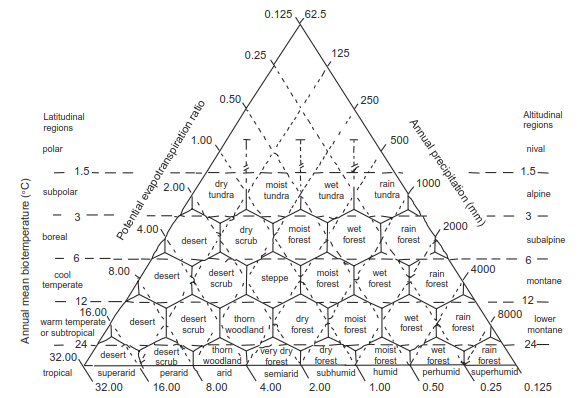
Fig. 24.3. Holdridge vegetation classification showing relationships among annual mean biotemperature, annual precipitation, annual potential evapotranspiration, and vegetation type. Annual average biotemperature is calculated from monthly temperature, setting temperatures below 0 °C to zero. Potential evapotranspiration ratio is annual potential evapotranspiration divided by annual precipitation. Temperature demarcations run horizontally ranging from 1.5 °C to 24 °C. Precipitation lines are parallel to the potential evapotranspiration ratio axis and range from 62.5 to 8000 mm. Potential evapotranspiration lines are parallel to the precipitation axis and range from 0.125 to 32. Adapted from Holdridge (1967).
In the Holdridge model, life zones are mapped as geometric hexagonal fields defined by intersecting axes of annual biotemperature, annual precipitation, and potential evapotranspiration ratio:
· Biotemperature: Calculated from monthly mean temperatures, converting values below 0 °C to 0.0 °C for baseline physiological scaling.
· Wet Tundra: Characterized by biotemperatures between 1.5 °C and 3.0 °C and annual precipitation of 250–500 mm.
· Wet Tropical Forest: Characterized by biotemperatures exceeding 24 °C and annual precipitation between 4000 and 8000 mm.
· Potential Evapotranspiration Ratio: Calculated as annual potential evapotranspiration divided by annual precipitation. Both wet tundra and wet tropical forest fall within the perhumid moisture province despite a tenfold precipitation difference, due to significantly reduced atmospheric evaporative demand in cold tundra climates.
The Holdridge framework remains a fundamental quantitative instrument for mapping global vegetation reallocations and predicting ecosystem structural shifts in response to global climate change.
Date added: 2026-09-24; views: 1;