
Impact of Land Use Change and Disturbance on Ecosystem Carbon
Land Use Dynamics and Ecosystem Carbon Cycling Dynamics. The most prominent atmospheric signal of land use and land-cover change is seen in the global carbon cycle. Deforestation serves as a major source of carbon emissions to the atmosphere, whereas forest regrowth (reforestation) and the establishment of new forests on previously non-forest land (afforestation) represent a substantial gain in carbon storage drawn down from the atmosphere. To understand these terrestrial carbon balances, researchers analyze both physical forest disturbance and recovery dynamics over multi-decadal timeframes.
Ecosystem Dynamics Following Forest Harvesting. Forest harvesting impacts fundamentally alter living biomass and surface organic pools. As illustrated in Fig. 23.15, idealized changes in terrestrial carbon pools occur following forest harvesting. In this representative example, timber harvesting reduces living biomass from 70 Mg C ha⁻¹ to 10 Mg C ha⁻¹. The harvesting process transfers the removed biomass to domestic and commercial wood products, which subsequently decay over time.
· Stage 1: Harvesting reduces living biomass from 70 Mg C ha⁻¹ to 10 Mg C ha⁻¹.
· Stage 2: Initial accumulation of debris increases dead biomass and soil organic carbon.
· Stage 3: Carbon accumulates in living biomass as the forest grows, recovering to pre-harvest levels by approximately 40 years.
· Stage 4: Long-term decomposition and detritus accumulation stabilize secondary organic carbon pools.
Carbon Pool Transformations and Flux Dynamics. Dead biomass and soil organic carbon (collectively categorized as other carbon pools) initially increase immediately following a harvest as a direct result of logging debris left on site. Over time, this carbon pool decreases as the debris decomposes, but it eventually increases again as the forest ages, litterfall increases, and organic detritus accumulates. The resulting net carbon flux shows an immediate initial release of approximately 30 Mg C ha⁻¹ yr⁻¹ to the atmosphere. Consequently, the forest ecosystem remains a net source of carbon over the next several years before transitioning into a carbon sink.
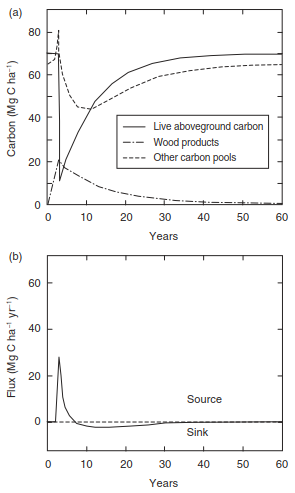
Fig. 23.15. Idealized changes in (a) ecosystem carbon pools and (b) the resulting carbon flux from harvest and regrowth in a temperate forest. 10 Mg ha⁻¹ = 1 kg m⁻². Adapted from Houghton (2005).
Soil Organic Carbon Dynamics in Grassland Conversion. Conversion of grassland to cropland typically reduces soil organic matter by 20–40 percent during the first few decades of active cultivation (Paustian et al. 2000). This sharp decline results from a reduced input of plant litter, an increased chemical quality of crop residues that promotes faster decomposition rates, and regular tillage, which mixes the soil profile and breaks up protective soil aggregates. Conversely, substantial quantities of soil organic matter can accumulate over time during the reversion of degraded cropland back to natural grassland (Post and Kwon 2000).
Historical Global Net Carbon Flux Trends. Net carbon flux from land use between 1850 and 2005 reflects complex historic shifts in global agriculture and land management, as depicted in Fig. 23.16. The net carbon flux driven by changes in land use—such as timber harvesting and land clearing for agricultural expansion—accounts for both the initial loss of carbon stored in vegetation and the subsequent regrowth and long-term changes in soil carbon. The net flux encompasses both carbon emissions from widespread deforestation and carbon sinks developing in forests recovering from historical harvests or agricultural abandonment.
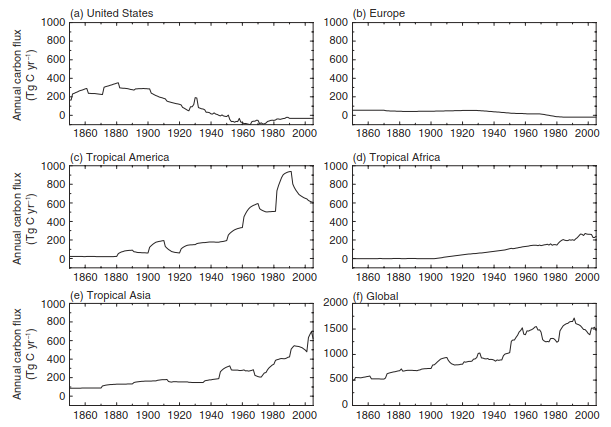
Fig. 23.16. Annual net carbon flux to the atmosphere from land use for the period 1850 to 2005. Shown are regional fluxes and the global total. Negative fluxes indicate carbon storage. Data updated from Houghton (1999, 2003) by Houghton (2008). See also Houghton et al. (2012). Data provided by the Carbon Dioxide Information Analysis Center (Oak Ridge National Laboratory, Oak Ridge, Tennessee).
· Historical Baseline (1850): Estimated global net carbon flux from land use changes was approximately 501 Tg C yr⁻¹ (1 Tg = 10¹² g).
· Peak Emissions (1991): Global carbon emissions from land use reached a historical maximum of 1712 Tg C yr⁻¹ before declining slightly.
· Cumulative Carbon Impact: Anthropogenic land use activities cumulatively added 156 Pg C to the atmosphere over the analyzed historical period.
· Regional Shifts in the United States: Land use emissions in the United States peaked in the late 1800s and steadily declined thereafter.
· Regional Trends in Tropical Regions: Carbon emissions from land use in tropical regions increased significantly, reaching peak rates in the late twentieth century.
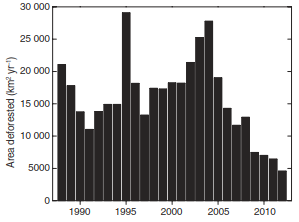
Fig. 23.14. Annual deforestation in the Amazonia region of Brazil, 1988–2012. Data provided by the Instituto Nacional de Pesquisas Espaciais, Brazil. See also Gloor et al. (2012).
Deforestation Dynamics in Amazonia. Annual deforestation in Amazonia exhibits substantial temporal variability, as recorded between 1988 and 2012 by the Instituto Nacional de Pesquisas Espaciais (INPE) in Brazil (Fig. 23.14; Gloor et al. 2012). Spikes in cleared land area exceeded 25,000 km² yr⁻¹ during peak years around 1995 and 2004, followed by significant downward trends in deforestation rates through 2012 due to policy and conservation interventions.
Biogeophysical Coupling and Surface Energy Balance. Land cover change profoundly alters the complex biogeophysical coupling existing between the terrestrial land surface and the lower atmosphere. Tall forests are aerodynamically rough compared with shorter structures such as grasslands and croplands (Table 13.1). Furthermore, forests generally exhibit a lower surface albedo compared with cropland, an effect that is particularly pronounced in snow-covered regions during winter periods (Figure 12.10).
Energy and Water Exchange Mechanics. Evapotranspiration ratio differences relative to available energy remain lower in forests than in certain agricultural crops, and are lower in coniferous forests than in broadleaf deciduous forests (Figure 17.10). These physical contrasts generate complex differences among vegetation types regarding the physical exchanges of energy, water, and momentum with the atmosphere (Bonan 2008). The prevailing scientific consensus indicates that tropical deforestation warms the local surface climate because the cooling effect resulting from the higher albedo of open cropland and pastureland is offset by surface warming arising from reduced evapotranspiration. In contrast, temperate and boreal deforestation is generally thought to cool the local climate, primarily due to the higher surface albedo of exposed snow cover (Chapter 28).
Ecological Disturbances and Climate Feedbacks. Large-scale ecological disturbances, such as severe wildfires and extensive insect defoliation, alter regional climate dynamics by disrupting fundamental ecosystem functions (O'Halloran et al. 2012). Wildfires exert a particularly strong influence on surface albedo, turbulent energy fluxes, and biogeochemical cycles within boreal forest regions (Table 23.1). Similarly, severe insect infestations and defoliation events can exert an equally strong impact on localized climate conditions.
Mountain Pine Beetle Epidemic Dynamics. Mountain pine beetle epidemics (Dendroctonus ponderosae) across western North American forests have heavily impacted vast tracts of timberland throughout British Columbia and the Rocky Mountain region of the United States (Edburg et al. 2012). In British Columbia alone, pine beetles have infested over 170,000 km² of forest, representing approximately 20 percent of the total forested area in the province.
- Attack Mechanism: Mountain pine beetles selectively attack and kill mature pine trees with large stem diameters.
- Carbon Consequences: Widespread tree mortality significantly reduces ongoing carbon uptake by forest stands (Kurz et al. 2008).
- Evapotranspiration Effects: Tree mortality drastically reduces regional evapotranspiration rates, directly warming the surface climate.
- Thermal Energy Redistribution: Energy that previously fueled latent heat fluxes via water evaporation becomes available as sensible heat to warm the land surface (Maness et al. 2013).
- Regional Thermal Impacts: Across the infested region, the epidemic caused a 19 percent reduction in summertime evapotranspiration and a 1 °C rise in summertime surface temperatures, with larger local temperature increases occurring in stands with the highest mortality.
Date added: 2026-09-24; views: 2;